

Histone modifiers, YY1 and p300, regulate the expression of cartilage-specific gene, chondromodulin-I, in mesenchymal stem cells
- PMID: 20663886
- PMCID: PMC2943260
- DOI: 10.1074/jbc.M110.116319
Histone modifiers, YY1 and p300, regulate the expression of cartilage-specific gene, chondromodulin-I, in mesenchymal stem cells
Abstract
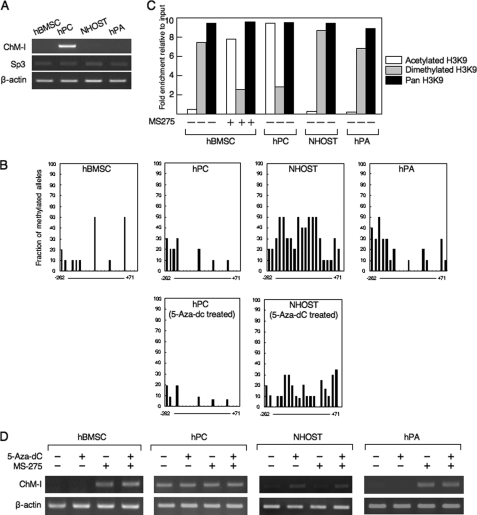
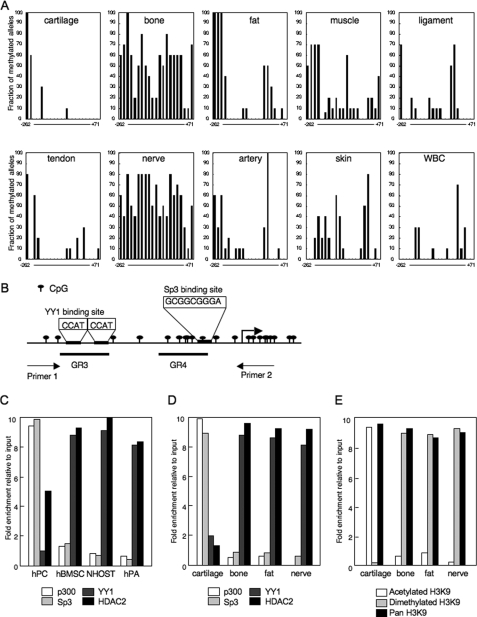
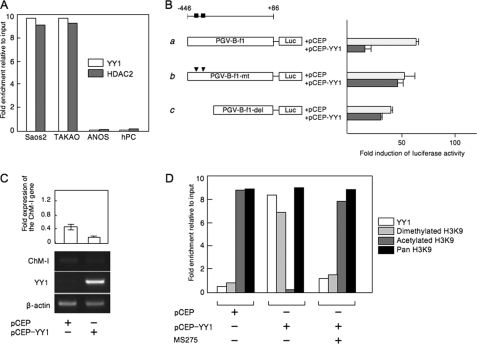
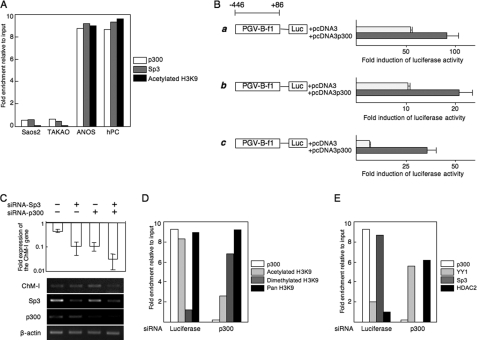
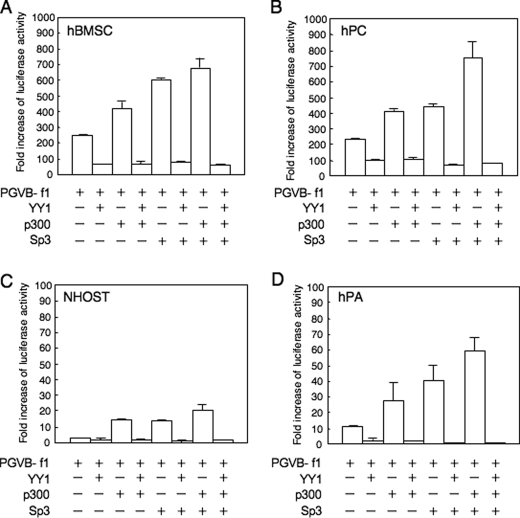
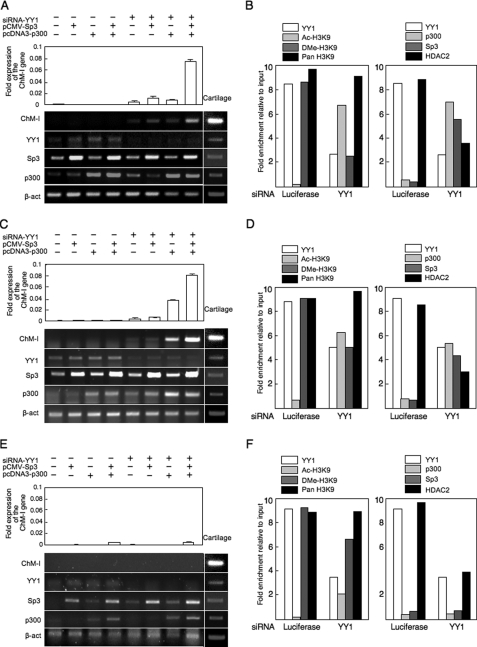
Elucidating the regulatory mechanism for tissue-specific gene expression is key to understanding the differentiation process. The chondromodulin-I gene (ChM-I) is a cartilage-specific gene, the expression of which is regulated by the transcription factor, Sp3. The binding of Sp3 to the core-promoter region is regulated by the methylation status of the Sp3-binding motif as we reported previously. In this study, we have investigated the molecular mechanisms of the down-regulation of ChM-I expression in mesenchymal stem cells (MSCs) and normal mesenchymal tissues other than cartilage. The core-promoter region of cells in bone and peripheral nerve tissues was hypermethylated, whereas the methylation status in cells of other tissues including MSCs did not differ from that in cells of cartilage, suggesting the presence of inhibitory mechanisms other than DNA methylation. We found that a transcriptional repressor, YY1, negatively regulated the expression of ChM-I by recruiting histone deacetylase and thus inducing the deacetylation of associated histones. As for a positive regulator, we found that a transcriptional co-activator, p300, bound to the core-promoter region with Sp3, inducing the acetylation of histone. Inhibition of YY1 in combination with forced expression of p300 and Sp3 restored the expression of ChM-I in cells with a hypomethylated promoter region, but not in cells with hypermethylation. These results suggested that the expression of tissue-specific genes is regulated in two steps; reversible down-regulation by transcriptional repressor complex and tight down-regulation via DNA methylation.
Figures
Similar articles
-
Cell-specific epigenetic regulation of ChM-I gene expression: crosstalk between DNA methylation and histone acetylation.Biochem Biophys Res Commun. 2008 Jan 4;365(1):124-30. doi: 10.1016/j.bbrc.2007.10.135. Epub 2007 Oct 31. Biochem Biophys Res Commun. 2008. PMID: 17980151
-
Methylation in the core-promoter region of the chondromodulin-I gene determines the cell-specific expression by regulating the binding of transcriptional activator Sp3.J Biol Chem. 2004 Jul 2;279(27):28789-97. doi: 10.1074/jbc.M401273200. Epub 2004 Apr 23. J Biol Chem. 2004. PMID: 15107420
-
Recruitment of histone deacetylase 4 by transcription factors represses interleukin-5 transcription.Biochem J. 2006 Dec 15;400(3):439-48. doi: 10.1042/BJ20061085. Biochem J. 2006. PMID: 16922677 Free PMC article.
-
Regulation of transcription factor YY1 by acetylation and deacetylation.Mol Cell Biol. 2001 Sep;21(17):5979-91. doi: 10.1128/MCB.21.17.5979-5991.2001. Mol Cell Biol. 2001. PMID: 11486036 Free PMC article.
-
Chondromodulin-1 in health, osteoarthritis, cancer, and heart disease.Cell Mol Life Sci. 2019 Nov;76(22):4493-4502. doi: 10.1007/s00018-019-03225-y. Epub 2019 Jul 17. Cell Mol Life Sci. 2019. PMID: 31317206 Free PMC article. Review.
Cited by
-
Sp1 in Astrocyte Is Important for Neurite Outgrowth and Synaptogenesis.Mol Neurobiol. 2020 Jan;57(1):261-277. doi: 10.1007/s12035-019-01694-7. Epub 2019 Jul 18. Mol Neurobiol. 2020. PMID: 31317491 Free PMC article.
-
Proteomic profiling of iPSC and tissue-derived MSC secretomes reveal a global signature of inflammatory licensing.NPJ Regen Med. 2025 Feb 4;10(1):7. doi: 10.1038/s41536-024-00382-y. NPJ Regen Med. 2025. PMID: 39905050 Free PMC article.
-
The oncogenic role of Yin Yang 1.Crit Rev Oncog. 2011;16(3-4):163-97. doi: 10.1615/critrevoncog.v16.i3-4.30. Crit Rev Oncog. 2011. PMID: 22248053 Free PMC article. Review.
-
Concise Review: The Regulatory Mechanism of Lysine Acetylation in Mesenchymal Stem Cell Differentiation.Stem Cells Int. 2020 Jan 28;2020:7618506. doi: 10.1155/2020/7618506. eCollection 2020. Stem Cells Int. 2020. PMID: 32399051 Free PMC article. Review.
-
YY1-induced lncRNA XIST inhibits cartilage differentiation of BMSCs by binding with TAF15 to stabilizing FUT1 expression.Regen Ther. 2022 Mar 29;20:41-50. doi: 10.1016/j.reth.2022.02.002. eCollection 2022 Jun. Regen Ther. 2022. PMID: 35402663 Free PMC article.
References
-
- Hiraki Y., Tanaka H., Inoue H., Kondo J., Kamizono A., Suzuki F. (1991) Biochem. Biophys. Res. Commun. 175, 971–977 - PubMed
-
- Aoyama T., Okamoto T., Nagayama S., Nishijo K., Ishibe T., Yasura K., Nakayama T., Nakamura T., Toguchida J. (2004) J. Biol. Chem. 279, 28789–28797 - PubMed
-
- Aoyama T., Okamoto T., Kohno Y., Fukiage K., Otsuka S., Furu M., Ito K., Jin Y., Nagayama S., Nakayama T., Nakamura T., Toguchida J. (2008) Biochem. Biophys. Res. Commun. 365, 124–130 - PubMed
-
- Caplan A. I. (1991) J. Orthop. Res. 9, 641–650 - PubMed
Publication types
MeSH terms
Substances
LinkOut - more resources
Full Text Sources
Research Materials
Miscellaneous
