. 2010 Aug 15;123(Pt 16):2844-52.
doi: 10.1242/jcs.065581. Epub 2010 Jul 27.

Occludin is required for cytokine-induced regulation of tight junction barriers

Affiliations

Occludin is required for cytokine-induced regulation of tight junction barriers

Christina M Van Itallie et al. J Cell Sci. .

Abstract

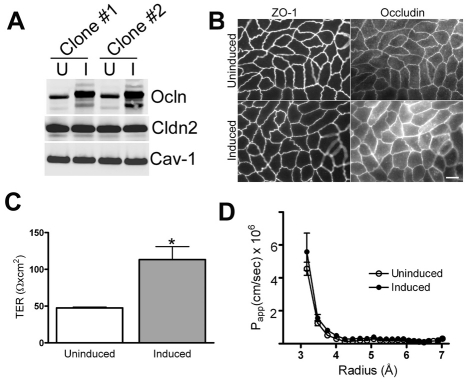
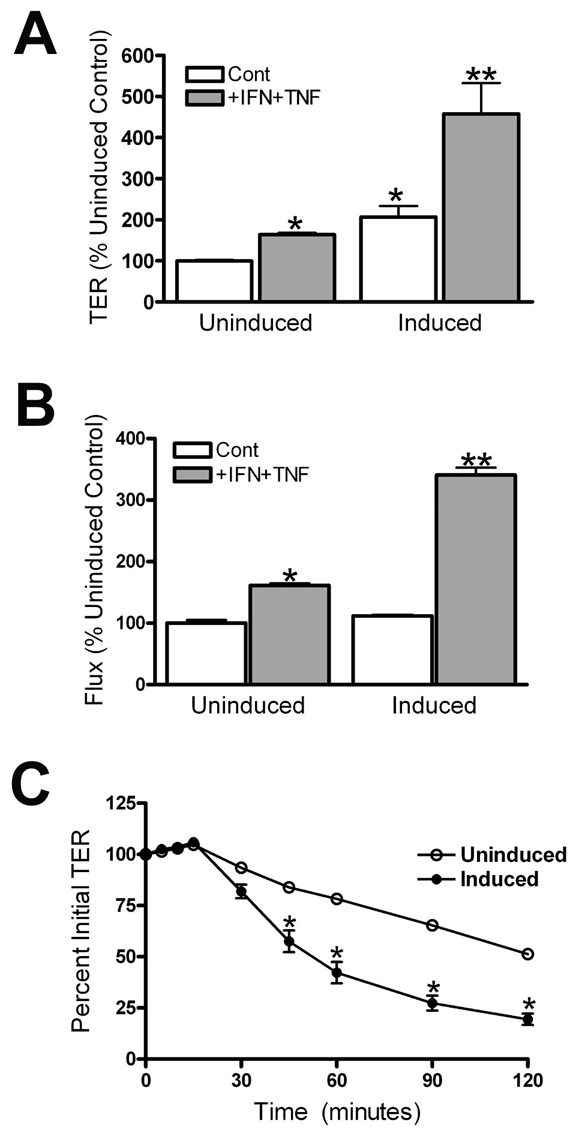
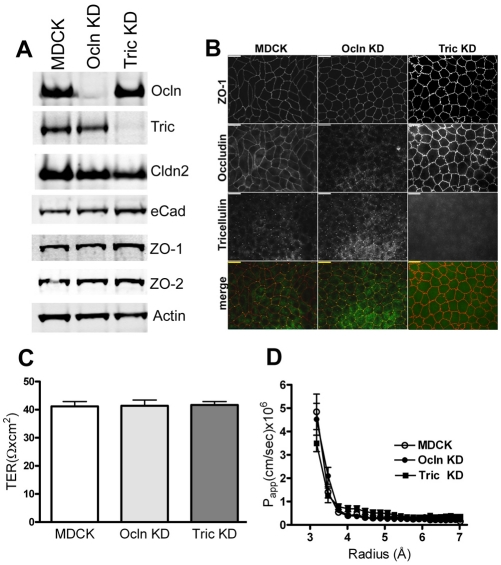
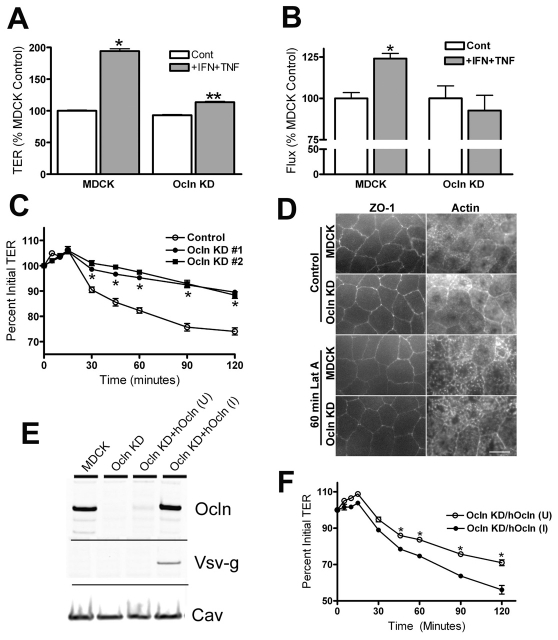
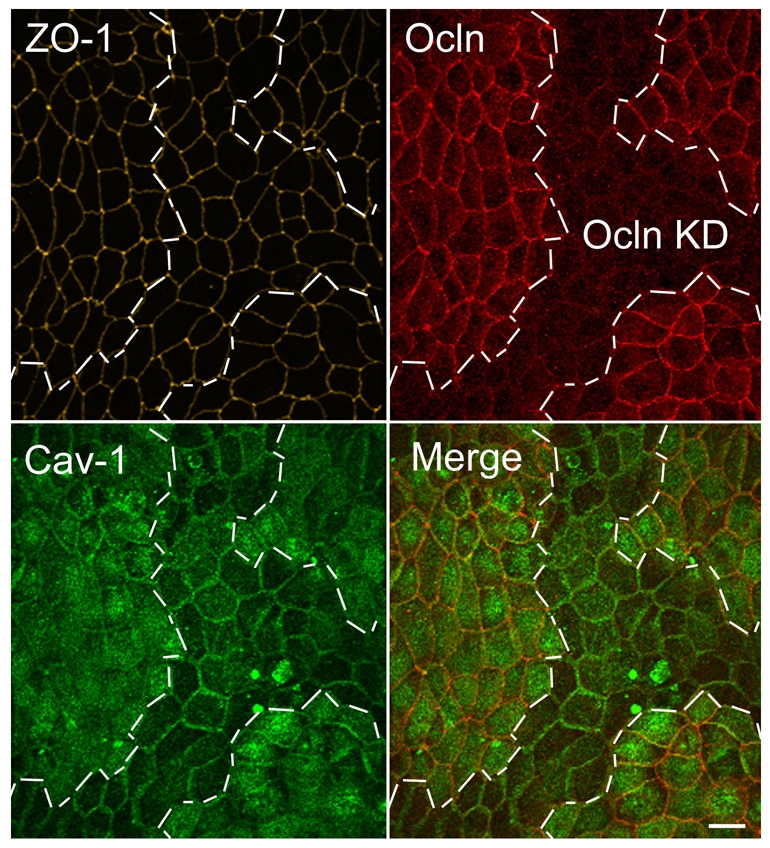
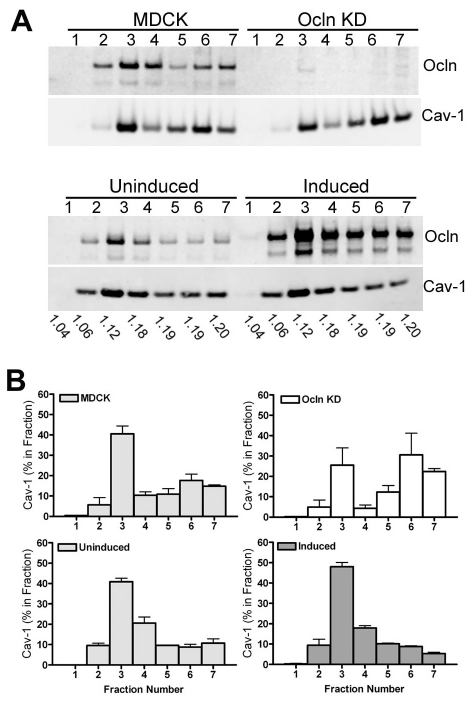
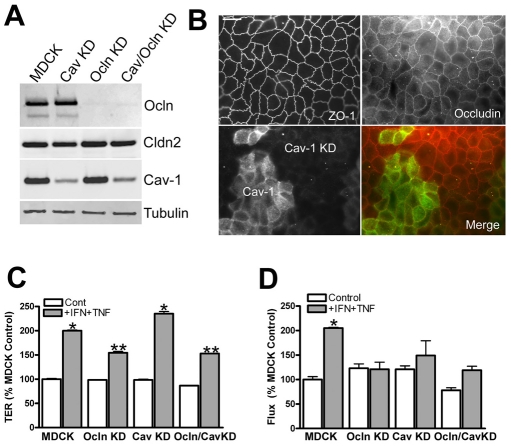
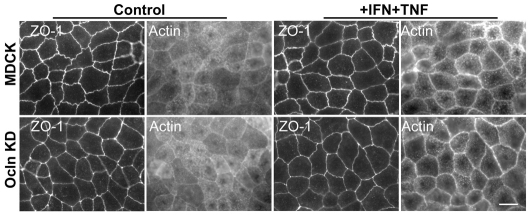
The function of occludin remains elusive. Proposed roles include maintenance of tight junction barriers, signaling and junction remodeling. To investigate a potential role in mediating cytokine-induced changes in barrier properties, we measured barrier responses to interferon-gamma plus TNFalpha in control, occludin-overexpressing and occludin knockdown MDCK II monolayers. MDCK cells show a complex response to cytokines characterized by a simultaneous increase in the transepithelial electrical resistance and a decrease in the barrier for large solutes. We observed that overexpression of occludin increased and occludin knockdown decreased sensitivity to cytokines as assessed by both these parameters. It is known that caveolin-1 interacts with occludin and is implicated in several models of cytokine-dependent barrier disruption; we found that occludin knockdown altered the subcellular distribution of caveolin-1 and that partitioning of caveolin into detergent-insoluble lipid rafts was influenced by changing occludin levels. Knockdown of caveolin decreased the cytokine-induced flux increase, whereas the increase in the electrical barrier was unaltered; the effect of double knockdown of occludin and caveolin was similar to that of occludin single knockdown, consistent with the possibility that they function in the same pathway. These results demonstrate that occludin is required for cells to transduce cytokine-mediated signals that either increase the electrical barrier or decrease the large solute barrier, possibly by coordinating the functions of caveolin-1.


Figures

Fig. 1.
Fig. 1.
Characterization of occludin-overexpressing MDCK cell lines. (A) Immunoblots of two cell lines that were uninduced (U) or induced (I) to express human occludin (Ocln) show an approximate fourfold increase in occludin levels, but no change in claudin-2 (Cln2) or caveolin-1 (Cav-1) expression. (B) Immunofluorescence imaging of ZO-1 and occludin in uninduced and induced cells reveals no change in the distribution or intensity of ZO-1 after occludin induction, but that the occludin signal in induced cells is brighter and more is present in intracellular compartments compared with uninduced cells. Scale bar: 8 μm. (C) Occludin induction (grey bar) increases TER by approximately twofold when compared with uninduced cells (white bar), from 47.6±1.3 Ω×cm2 to 113.3±17.6 Ω×cm2, *P<0.002. (D) Measurement of the size-dependence of paracellular permeability assessed with PEG oligomers reveals no change in flux for uncharged molecules in the size range of 3-7 Å after occludin induction (closed circles). All experiments were performed with two separate clonal cell lines at least twice.
Fig. 2.
Fig. 2.
Occludin overexpression increases cytokine responses. (A) Cytokine treatment results in a 1.7-fold increase in TER (from 49±1 to 83±3 Ω×cm2) in uninduced MDCK cells and in a greater than 2-fold increase in TER (from 100±13 to 222±36 Ωs×cm2) in cells overexpressing occludin. (B) Measurement of paracellular flux with fluorescein-labeled 3-kDa dextran after cytokine treatment of MDCK cells uninduced and induced to express human occludin shows a similar increase in response. Dextran flux is similar in both uninduced and induced untreated cell lines; flux increases 60% after cytokine treatment in uninduced cells and more than threefold in cells overexpressing occludin. *P<0.05 compared with uninduced controls; **P<0.02 when compared with cytokine-treated uninduced cells. All experiments were performed with two separate clonal cell lines, two or more times. (C) Time course of reduction of TER in cells uninduced and induced to overexpress occludin in response to Latrunculin A (added at 0 minutes). The electrical barrier is significantly more sensitive to disruption when occludin is overexpressed.
Fig. 3.
Fig. 3.
Characterization of occludin and tricellulin knockdown (KD) MDCK cell lines reveals no changes in expression and localization of other proteins and barrier function. (A) Immunoblots of occludin (Ocln), tricellulin (Tric), claudin-2 (Cldn2), E-cadherin (eCad), ZO-1, ZO-2 and actin in MDCK II Tet-Off parental cells and representative Ocln KD and Tric KD cell lines. Ocln and Tric KDs expressed less than 5% of the respective endogenous protein levels; there were no consistent changes in the expression levels of the other tight and adherens junction proteins tested. Actin was used as a loading control. (B) Co-immunolocalization of ZO-1, Ocln and Tric in control and KD cell lines shows no consistent changes in cell shape or tight junction protein localization. Scale bars: 10 μm; the merged images show ZO-1 (red) and tricellulin (yellow). (C,D) Measurement of TER (C) and size-dependence of paracellular permeability assessed with PEG oligomers (D) revealed no significant change in barrier characteristics in control MDCK, Ocln KD and Tric KD monolayers; at least three separate clonal KD cell lines were compared for each measurement, each assayed in triplicate.
Fig. 4.
Fig. 4.
Ocln KD cell lines are less sensitive to proinflammatory cytokines. (A) Treatment of parental MDCK II Tet-Off cells resulted in a 1.9-fold increase in TER (from 56±2 to 107±6 Ω×cm2), while treatment of occludin KD cells increased TER only 1.2-fold above untreated levels (from 52±2 to 62±6 Ω×cm2). (B) Treatment of MDCK control and Ocln KD monolayers with TNFα and IFNγ resulted in a significant increase in flux of fluorescent 3-kDa dextran in control cells but not in Ocln KD cells. (C) Administration of Latrunculin A (0.5 μM) to monolayers of control MDCK and two separate Ocln KD cell lines resulted in time-dependent decreases in TER in all cell lines; however, the decrease in Ocln KD cells is significantly less than in MDCK controls at all time points longer than 30 minutes. (D) Rhodamine-phalloidin labeling of F-actin (right panels) at the cellular level of maximal ZO-1 staining intensity (left panels) in untreated MDCK (top row) and Ocln KD cells (second row) revealed similar actin localization; 60 minutes of 0.5 μM Latrunculin A (Lat A) treatment of MDCK (third row) and Ocln KD cells (bottom row) did not alter continuous ZO-1 staining in either cell line but resulted in similar changes in actin localization. (E) Immunoblot analysis of MDCK control cells, Ocln KD cells and Ocln KD cells transfected with a Tet-responsive vector containing Vsv-g-tagged human Ocln either uninduced (U) or induced (I) to express Ocln-Vsv-g; blots were probed for Ocln, using an antibody that recognizes both canine and human occludin, Vsv-g and caveolin-1; the results shown are representative of two similar clones; occludin induction levels are 1.5-fold control values. (F) Re-expression of an Ocln transgene restores Latrunculin A sensitivity. Treatment of Ocln KD cells (two independent clonal cell lines) uninduced (U) and induced (I) to express human Ocln with 0.5 μM latrunculin A demonstrates induction of Ocln is associated with increased sensitivity to latrunculin A and thus results in a larger decrease in TER (*P<0.05 or less, t-test).
Fig. 5.
Fig. 5.
Maximum density confocal projection of occludin and caveolin-1 immunofluorescence in mixed populations of MDCK control and Ocln KD cells reveals global differences in caveolin distribution. MDCK parental and Ocln KD cells were co-cultured on Transwell filters, fixed and stained for Ocln, ZO-1 and caveolin and imaged using confocal microscopy. All sections through cells were collapsed to reveal the overall distribution of caveolin; boundaries of parental and KD are delineated with white dashed lines. ZO-1 immunofluorescence is identical in control and KD cells (yellow, top right). Ocln immunofluorescence (top right panel, red) identifies control and KD cells. Caveolin (bottom left panel, green) staining is brighter in control cells than in KD cells and more appears to be present in intracellular vesicles and/or on the apical surface. The merged image (right panel, red Ocln red; green caveolin) demonstrates brighter apical membrane and/or cytosolic staining of caveolin in Ocln-positive cells and more obvious lateral membrane staining in Ocln KD cells. Scale bar: 10 μm.
Fig. 6.
Fig. 6.
Partitioning of caveolin-1 with low-density lipid rafts is influenced by the level of Ocln. (A) Immunoblot of representative sucrose density gradient fractions from parental MDCK, Ocln KD (top panels) and MDCK cells uninduced (U) and induced (I) to express the human Ocln transgene (bottom panels). The density of each fraction is shown below the immunoblot. (B) Quantification of replicate sucrose gradients reveals a shift in caveolin-1 from less to more dense fractions in Ocln KD cells compared with the MDCK parental cell lines (compare top panels) and a shift in the opposite direction in Ocln-overexpressing cells (bottom two panels); each gradient was repeated with at least two different clonal cell lines.
Fig. 7.
Fig. 7.
Caveolin KD does not affect occludin levels or distribution but does decrease the sensitivity of flux to cytokines. (A) Immunoblot analysis of KD cells lines reveals partial KD of caveolin (80-85%) in both parental and occludin KD lines. Claudin-2 levels appear slightly lower in the Cav-1 KD line, but this was not seen in other KD lines; α-tubulin was used as a loading control. (B) Cav-1 KD does not alter occludin or ZO-1 immunolocalization; this is best seen in a cell line with a mixed population of caveolin-expressing and KD cells: ZO-1 (top left) and occludin (top right) are similar in all cells; caveolin-1 (green, bottom left), and merged with occludin (red, bottom right). Scale bar: 5 μm. (C) Occludin but not caveolin KD decreases sensitivity to cytokines as measured by TER, but (D) both occludin and caveolin KD decrease sensitivity to cytokine treatment as measured by dextran flux; the effect of the double occludin-caveolin KD was not different from that of occludin KD alone. *P<0.02 compared with MDCK controls, **P<0.05 compared with cytokine-treated MDCK cells; each experiment was repeated with at least two separate clonal cell lines.
Fig. 8.
Fig. 8.
Occludin does not mediate changes in cytokine sensitivity via differential changes in actin localization after cytokine treatment. Fluorescent-actin localization in parental MDCK parental or occludin KD cells at the level of ZO-1 (left four panels) reveals diffuse apical actin and a thin peri-junctional actin ring. Treatment with IFNγ +TNFα (right four panels) caused no appreciable change in ZO-1 staining and a similar increased concentration of peri-junctional actin in both the parental and KD cells. Scale bar: 10 μm.

Similar articles

Cited by

References

    1. Balda M. S., Whitney J. A., Flores C., Gonzalez S., Cereijido M., Matter K. (1996). Functional dissociation of paracellular permeability and transepithelial electrical resistance and disruption of the apical-basolateral intramembrane diffusion barrier by expression of a mutant tight junction membrane protein. J. Cell Biol. 134, 1031-1049 - PMC - PubMed
    1. Balda M. S., Flores-Maldonado C., Cereijido M., Matter K. (2000). Multiple domains of occludin are involved in the regulation of paracellular permeability. J. Cell Biochem. 78, 85-96 - PubMed
    1. Capaldo C. T., Nusrat A. (2009). Cytokine regulation of tight junctions. Biochim. Biophys. Acta 1788, 864-871 - PMC - PubMed
    1. Clayburgh D. R., Barrett T. A., Tang Y., Meddings J. B., Van Eldik L. J., Watterson D. M., Clarke L. L., Mrsny R. J., Turner J. R. (2005). Epithelial myosin light chain kinase-dependent barrier dysfunction mediates T cell activation-induced diarrhea in vivo. J. Clin. Invest 115, 2702-2715 - PMC - PubMed
    1. Coyne C. B., Shen L., Turner J. R., Bergelson J. M. (2007). Coxsackievirus entry across epithelial tight junctions requires occludin and the small GTPases Rab34 and Rab5. Cell Host Microbe 2, 181-192 - PMC - PubMed

Publication types