. 2010 Nov 18;116(20):4103-15.
doi: 10.1182/blood-2010-01-262790. Epub 2010 Jul 27.

Essential role for focal adhesion kinase in regulating stress hematopoiesis

Affiliations

Essential role for focal adhesion kinase in regulating stress hematopoiesis

Sasidhar Vemula et al. Blood. .

Abstract

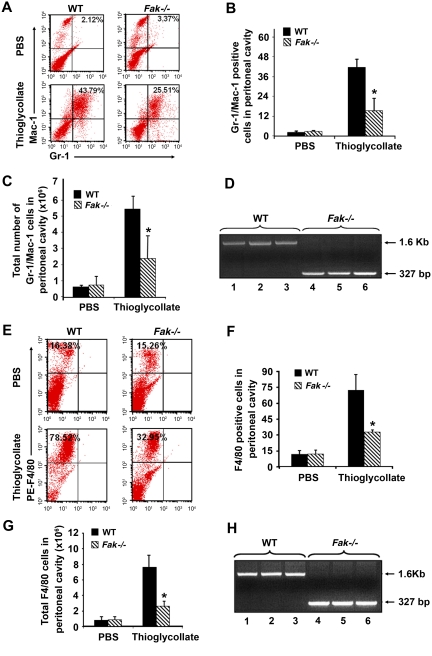
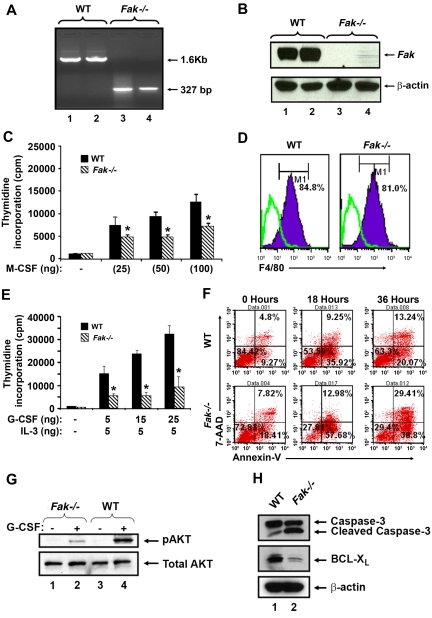
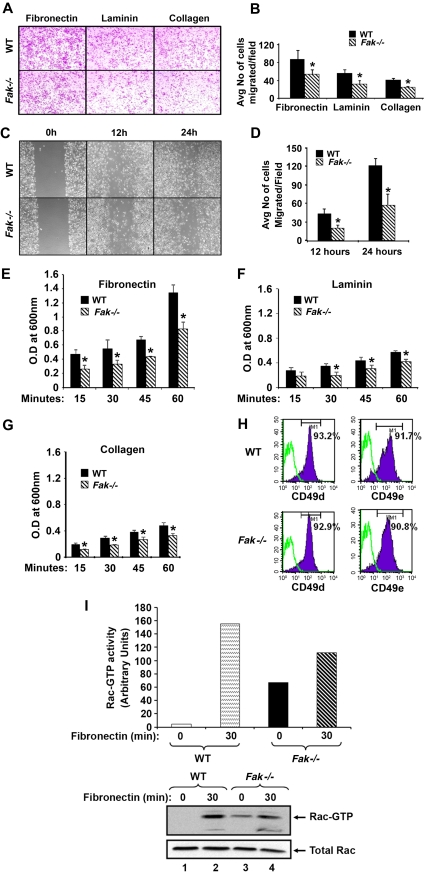
Focal adhesion kinase (FAK) is a non-receptor tyrosine kinase that has been extensively studied in fibroblasts; however its function in hematopoiesis remains an enigma. FAK is thought to be expressed in myeloid and erythroid progenitors, and its expression is enhanced in response to cytokines such as granu-locyte macrophage colony-stimulating factor. Furthermore, bone marrow cells cultured in granulocyte macrophage colony-stimulating factor show active migration and chemoattractant-induced polarization, which correlates with FAK induction. While loss of FAK in mice results in embryonic lethality, we have deleted FAK in the adult bone marrow. We show an essential role for FAK in regulating hemolytic, myelotoxic, as well as acute inflammatory stress responses in vivo. In vitro, loss of FAK in erythroid and myeloid progenitor's results in impaired cytokine induced growth and survival, as well as defects in the activation and expression of antiapoptotic proteins caspase 3 and Bcl-x(L). Additionally, reduced migration and adhesion of myeloid cells on extracellular matrix proteins, as well as impaired activation of Rac GTPase is also observed in the absence of FAK. Our studies reveal an essential role for FAK in integrating growth/survival and adhesion based functions in myeloid and erythroid cells predominantly under conditions of stress.


Figures

Figure 1
Figure 1
Cre-mediated deletion of Fak in BM and spleen. (A) Cre-mediated deletion of FAK was induced by 3 intraperitoneal injections of 300 μg poly (I):(C) at 1-day intervals. One month after the final injection, DNA was extracted from BM and spleen and analyzed by PCR. Cre-mediated deletion of Fak was detected as a 327-bp fragment and that of WT Fak was observed as a 1.6-kb fragment. (B) Cre-mediated deletion of Fak after various times after poly (I):(C) treatment. One, 2, and 3 months following final injection of poly (I):(C), DNA was extracted from BM and analyzed by PCR. Cre-mediated deletion of Fak was detected as a 327-bp fragment and that of WT Fak was observed as a 1.6-kb fragment. Lanes 1, 2, and 3 represent WT FAK bands 1, 2, and 3 months after induction, respectively. Lanes 4, 5, and 6 represent Fak deletion in BM 1, 2, and 3 months after induction, respectively.
Figure 2
Figure 2
Impaired myelopoiesis in Fak−/− mice. (A) Whole BM cells from WT and Fak−/− mice were analyzed for the expression of myeloid cell marker Gr-1 and Mac-1 by flow cytometry. The percentage of Gr-1/Mac-1 high double-positive cells (R2) and Gr-1/Mac-1 low positive cells (R3) in the BM are indicated in the square of each dot blot. Shown are results from a representative experiment. (B) Bar graph represents the mean values of Gr-1/Mac-1 high double-positive cells in the BM of WT and Fak−/− mice (n = 8; *P < .05). (C) Whole BM cells from WT and Fak−/− mice were stained with Annexin V and 7-AAD and analyzed by flow cytometric analysis. Numbers in each quadrant represent the percentage of cells in various stages of apoptosis. (D) Quantitative analysis of the percentage of BM cells undergoing early apoptosis (Annexin V) in WT and Fak−/− mice. Bars represent the mean of 3 independent experiments consisting of 3 pairs of mice of each genotype for each experiment (n = 9; *P < .05). (E) Reduced CFU-Cs in Fak−/− BM. LDBM cells (1.5 × 10⁴) from WT and Fak−/− mice were plated in a methylcellulose colony-forming assay in the presence of the indicated cytokines. Colonies were enumerated 7 days later. Bar graph shows the mean number of colonies from 3 independent mice of each genotype plated in triplicates. *P < .05, Fak−/− versus WT. Similar results were obtained in 3 additional pairs of mice of each genotype. (F) WT and Fak−/− progenitors were subjected to an in vitro migration assay in response to SDF-1 or SCF on FN. Briefly, LDBM cells isolated from WT and Fak−/− mice were cultured in the presence of SCF, TPO, IL-6, and FLT-3 for 2 days. Cells (0.5 × 10⁶) were subjected to transwell migration assay for 5 hours at 37°C. After 5 hours of incubation at 37°C, nonmigrated cells in the upper chamber were removed with a cotton swab. The migrated cells attached to the bottom surface of the membrane were stained with 0.1% crystal violet, dissolved in 0.1M borate, pH 9.0, and 2% ethanol for 5 minutes at room temperature. Photomicrographs shown are progenitor cells migrated on FN in response to SDF-1 or SCF. (G) The number of migrated cells per membrane was counted in 10 random fields with an inverted microscope using 20× objective lens; cells migrated into the lower chamber in response to SDF-1 or SCF are counted using hemocytometer from replicates of 3 from 1 experiment using 3 mice of each genotype. *P < .05, Fak−/− vs WT, mean ± SEM. (H) Primary erythroid progenitor proliferation was assessed by incorporation of radioactive thymidine in WT and Fak−/− cells. Briefly, erythroid progenitor cells grown for 2 days were starved in Stem Pro 34 medium without any growth factors or supplements for 4 hours. Erythroid progenitor cells (5 × 10⁴) were placed in a 96-well plate in 200 μL complete medium either in the absence or in the presence of indicated concentration of EPO, SCF alone, or in combination. Cells were cultured for 48 hours and subsequently pulsed with 1.0 μCi (0.037 MBq) [3H] thymidine for 6 hours. Cells were harvested using an automated 96-well cell harvester, and thymidine incorporation was determined as cpm. Bar graph shows pooled data from 2 independent experiments performed in replicates of 4 using 4 mice per genotype per experiment. *P < .05, Fak−/− vs WT, mean ± SEM. (I) Quantitative analysis of the percentage of primary erythroid cells undergoing early apoptosis (Annexin V) in WT and Fak−/− cells. Cells were harvested after 4 days of culture and starved in absence of growth factors or supplements for 6 hours. Bar graph represents the mean of Annexin V–positive cells for 1 independent experiment performed in triplicates. *P < .05, Fak−/− vs WT, mean ± SD. (J) Erythroid progenitor cells were cultured for 4 days and starved in absence of growth factors or supplements for 4 hours and stimulated with SCF and EPO at 37°C. Cell lysates (35 μg) were subjected to Western blot analysis using indicated antibodies.
Figure 3
Figure 3
Defective erythropoiesis in Fak−/− mice during PHZ-induced anemia. WT and Fak−/− mice were treated with PHZ (100 mg/kg at day 0). At the indicated time points, hematocrits (A), spleen weight (B), splenic cellularity (C), photomicrographs of spleen (D), flow cytometry based analysis of the frequency (percentage) of Ter119/CD71 positive erythroblasts (R3, R4, and R5) in the spleen (E), absolute number of Ter119/CD71-positive erythroblasts in the spleen (F), absolute number of erythroid burst-forming units and erythroid colony-forming units in the spleen (G), frequency (percentage) of Ter119/CD71-positive erythroblasts (R3) in the BM (H), and percent of Ter119/CD71-positive erythroblasts in the BM were assessed (I). For each analysis, mean ± SEM are illustrated (n = 3 mice per group, 2 independent experiments were performed; *P < .05). (J) Cre-mediated deletion of Fak was detected in BM and spleen after 8 days of PHZ treatment as a 327-bp fragment. WT allele of Fak was detected as a 1.6-kb fragment. Lanes 1, 2, and 3 represent WT Fak bands after 8 days of PHZ treatment in BM and spleen, respectively. Lanes 4, 5, and 6 show Fak deletion in BM and spleen after 8 days of PHZ treatment, respectively.
Figure 4
Figure 4
Delayed and reduced recovery of Fak−/− myeloid progenitors in response to 5-FU. (A) Whole BM cells from WT and Fak−/− mice were harvested at 0, 3, 9, and 14 days after 5-FU injection and stained with FITC-conjugated anti–Mac-1, anti-B220, anti-CD3, anti–Gr-1, anti-F4/80, and anti-Ter119 antibodies. Subsequently, cells were stained with PE-conjugated antibody to Sca-1 and APC-conjugated–c-Kit antibody. c-Kit and Sca-1 expression were determined on lineage negative cells (LSK cells). Upper right quadrant in each dot blot indicates the percentage of LSK cells in WT and Fak−/− mice at 0, 3, 9, and 14 days after 5-FU treatment. (B) Line chart represents the mean value of percent LSK cells in WT and Fak−/− BM at the indicated time points after 5-FU treatment (n = 3-6 mice; *P < .05). (C) The percentage of Gr-1/Mac-1 double-positive cells in the BM of representative WT and Fak−/− mouse is indicated in the upper right quadrant of each dot blot in response to 5-FU at indicated days after 5-FU treatment. (D) Line chart represents the percentage of Gr-1/Mac-1 double-positive cells in WT and Fak−/− mice at 0, 3, 9, and 14 days after 5-FU treatment from 2 independent experiments (n = 3 mice per group, mean ± SEM; *P < .05).
Figure 5
Figure 5
Impaired recruitment of myeloid cells to sites of inflammation in a model of acute peritonitis. (A) Impaired accumulation of Gr-1/Mac-1 double-positive cells in the inflamed peritoneum of Fak−/− mice. WT and FAK−/− mice were given intraperitoneal injections of 4% thioglycollate. Peritoneal lavage was collected 4 hours after injection, and Gr-1 and Mac-1 expression was examined by flow cytometry. Dot blots represent Gr-1/Mac-1–positive cells in the peritoneal cavity of WT and Fak−/− mice, analyzed following PBS or thioglycollate injection. (B) Quantitative analysis of the percentage of Gr-1/Mac-1 double-positive cells in the peritoneal cavity of WT and Fak−/− mice after PBS or thioglycollate injections (n = 3; *P < .05). (C) Quantitative analysis of the total number of Gr-1/Mac-1–positive cells recruited into peritoneal cavity of WT and Fak−/− mice after PBS or thioglycollate injections (n = 3; *P < .05). (D) DNA was extracted from peritoneal cavity-derived cells and analyzed by PCR. Cre-mediated deletion of Fak was detected as a 327-bp fragment, and WT Fak was observed as a1.6-kb fragment. Lanes 1, 2, and 3 represent WT Fak bands after 4 hours of thioglycollate treatment in peritoneal cavity-derived cells. Lanes 4, 5, and 6 shows Fak deletion in peritoneal cavity-derived cells after 4 hours of thioglycollate treatment. (E) WT and FAK−/− mice were given intraperitoneal injections of 4% thioglycollate. Peritoneal lavage was collected 4 days after injection, and F4/80-positive cells were detected by flow cytometry. Upper left quadrant of each dot blot represents the percentage of phycoerythrin-conjugated F4/80-positive cells in WT and FAK−/− peritoneum after PBS or thioglycollate injections. (F) Quantitative analysis of the percentage of F4/80 positive cells in the peritoneal cavity of WT and Fak−/− mice after PBS or thioglycollate injections (n = 3; *P < .05, 4 pairs of WT and Fak−/− mice). (G) Quantitative analysis of the total number of F4/80 cells recruited to the peritoneal cavity of WT and Fak −/− mice after PBS or thioglycollate injection (n = 3; *P < .05, 4 pairs of WT and Fak−/−). (H) DNA was extracted from peritoneal cavity-derived cells and analyzed by PCR. Cre-mediated deletion of FAK was detected as a 327-bp fragment, and the WT Fak allele was observed as a 1.6-kb fragment. Lanes 1, 2, and 3 represent WT Fak bands in the peritoneal cavity-derived cells after 4 days of thioglycollate treatment. Lanes 4, 5, and 6 represent FAK deletion in cells recruited into the peritoneal cavity after 4 days of thioglycollate treatment.
Figure 6
Figure 6
Deletion of FAK in BMM and neutrophil cells results in reduced proliferation, survival, and activation of antiapoptotic proteins. (A) Cre-mediated Fak deletion in BMMs: after 1 month of poly (I):(C) injection, BM cells from WT and Fak−/− mice were cultured for 7 days, and DNA was extracted. Lanes 1 and 2 represent WT Fak bands, and lanes 3 and 4 represent FAK deleted bands. (B) Western blot analysis demonstrating the expression of Fak in WT and Fak−/− cells. Equal amount of cell lysates were subjected to Western blot analysis. Blot was probed with an antibody specific to FAK (raised against amino acids 903-1052). The same blot was reprobed for β-actin to show equal loading. (C) Cells were subjected to proliferation assay in the absence of growth factors as well as in the presence of indicated concentrations of M-CSF. After 48 hours of culture, cells were pulsed with [3H] thymidine for 6 hours. Concentrations of M-CSF are shown on the x-axis, and mean thymidine incorporation (in cpm) are shown on the y-axis. Shown are results from 1 of 3 independent experiments performed in quadruplicate; *P < .05. (D) Expression of F4/80 on WT and Fak−/− cells. Cells were stained with PE-conjugated anti-F4/80 antibody and subjected to flow cytometric analysis. Solid histograms indicate the level of F4/80 expression on the surface of WT and Fak−/− cells, while open histograms indicate the level of expression using an isotype control antibody. (E) BM cells grown in G-CSF were subjected to proliferation assay in the absence of growth factors and in the presence of indicated concentrations of various cytokines. After 48 hours of culture, cells were pulsed with [3H] thymidine for 6 hours. Concentrations of various cytokines are shown on the x-axis, and mean thymidine incorporation (in cpm) is shown on the y-axis. Bar graph shows data from 1 experiment performed in replicates of 4 (*P < .05). Similar findings were observed in 3 additional independent experiments. (F) BM cells grown in G-CSF derived from WT and FAK-deficient mice were starved of growth factors for indicated times and subjected to flow cytometric analysis after staining with Annexin V and 7-AAD. The percentages of early and late apoptotic cells at each time point are indicated. Shown is a representative dot blot from 1 of 3 independent experiments. (G) WT and Fak-deficient cells grown in the presence of IL-3 and G-CSF were starved of growth factors and stimulated for 5 minutes with G-CSF. Upper panel shows the activation of AKT as assessed by Western blot analysis using an anti–phospho AKT antibody. Bottom panel shows total AKT levels in each lane. (H) Actively growing neutrophils derived from WT and Fak−/− mice were subjected to Western blot analysis using an anti–caspase 3 (upper panel), anti–Bcl-xL (middle panel), and anti–β-actin (bottom panel) antibody. Similar results were observed in 2 additional independent experiments.
Figure 7
Figure 7
Deficiency of FAK in BMMs alters actin-based functions. (A) WT and Fak−/− cells (2.5 × 10⁵) were subjected to an in vitro migration assay on FN, laminin, and collagen. Images were acquired through a Zeiss Axioskop 2 Plus microscope equipped with a Plan-Neofluar 20×/0.5 objective lens, and were captured with an Axiocam MRC-5 camera and Axiovision 4 software (all from Zeiss). (B) A quantitative assessment of the number of WT and Fak−/− cells migrated through wells coated with FN, laminin, and collagen. Bars represent mean number of cells migrated ± standard deviation on various extracellular matrix proteins. Ten fields were scored in each experiment. Similar results were observed in 3 additional experiments (n = 3; *P < .05, WT vs Fak−/−). (C) WT and Fak−/− cells were cultured for 8 days in 24-well plates in the presence of 100 ng/mL M-CSF. An artificial wound was created in the monolayer using a pipet tip. Images were taken immediately and again at indicated time periods after creating the wound. Photomicrograph is from an independent experiment. (D) Bar graph shows quantitative analysis of the number of migrated cells in the wounded area. Data are from 1 representative experiment (n = 3; *P < .05 WT vs Fak−/−). WT and Fak−/− cells (5 × 10⁵) were subjected to an in vitro adhesion assay on FN, laminin, and collagen. Adhesion was assessed by measuring absorbance at indicated times on extracellular matrix proteins FN (E), laminin (F), and collagen (G). Bar graph represents the optical density of adherent cells at 600 nm. Data shown are from 1 representative experiment; *P < .05, WT vs Fak−/−. Similar findings were observed in 3 independent mice. (H) Expression of integrins on WT and Fak−/− cells. Cells were stained with PE-conjugated anti-α4β1 and PE-conjugated anti-α5β1 antibody and subjected to flow cytometric analysis. Top panel solid histograms indicate the level of α4β1 and α5β1 expression on the surface of WT cells and bottom panel solid histograms indicate the level of α4β1 and α5β1 expression on the surface of Fak−/− cells. Open histograms demonstrate the level of expression using an isotype control antibody in both panels. Similar results were observed in 3 independent experiments. (I) WT and FAK-deficient cells grown in the presence of M-CSF for 3 days were starved of growth factors and stimulated on FN for indicated times. Lysates were subjected to Rac activity assay. Quantification of the level of active Rac is shown in bar graphs. Bottom panels show the level of active Rac (Rac GTP) and total Rac protein from 1 of 2 independent experiments performed.

Similar articles

Cited by

References

    1. Schaller MD, Borgman CA, Cobb BS, Vines RR, Reynolds AB, Parsons JT. pp125FAK a structurally distinctive protein-tyrosine kinase associated with focal adhesions. Proc Natl Acad Sci U S A. 1992;89(11):5192–5196. - PMC - PubMed
    1. Hanks SK, Calalb MB, Harper MC, Patel SK. Focal adhesion protein-tyrosine kinase phosphorylated in response to cell attachment to fibronectin. Proc Natl Acad Sci U S A. 1992;89(18):8487–8491. - PMC - PubMed
    1. Guan JL, Shalloway D. Regulation of focal adhesion-associated protein tyrosine kinase by both cellular adhesion and oncogenic transformation. Nature. 1992;358(6388):690–692. - PubMed
    1. Parsons JT. Focal adhesion kinase: the first ten years. J Cell Sci. 2003;116(Pt 8):1409–1416. - PubMed
    1. Sieg DJ, Hauck CR, Ilic D, et al. FAK integrates growth-factor and integrin signals to promote cell migration. Nat Cell Biol. 2000;2(5):249–256. - PubMed

Publication types

MeSH terms