. 2010 Aug;120(8):2684-98.
doi: 10.1172/JCI42118. Epub 2010 Jul 26.

Sema3E-Plexin D1 signaling drives human cancer cell invasiveness and metastatic spreading in mice

Affiliations

Sema3E-Plexin D1 signaling drives human cancer cell invasiveness and metastatic spreading in mice

Andrea Casazza et al. J Clin Invest. 2010 Aug.

Erratum in

  • J Clin Invest. 2011 Jul 1;121(7):2945. Mazzone, Massimilano [corrected to Mazzone, Massimiliano]

Abstract

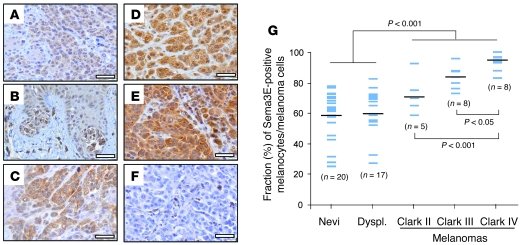
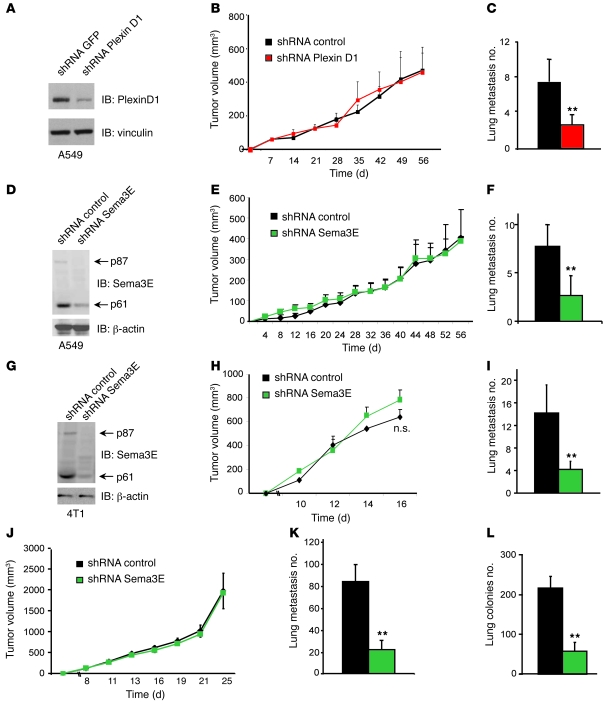
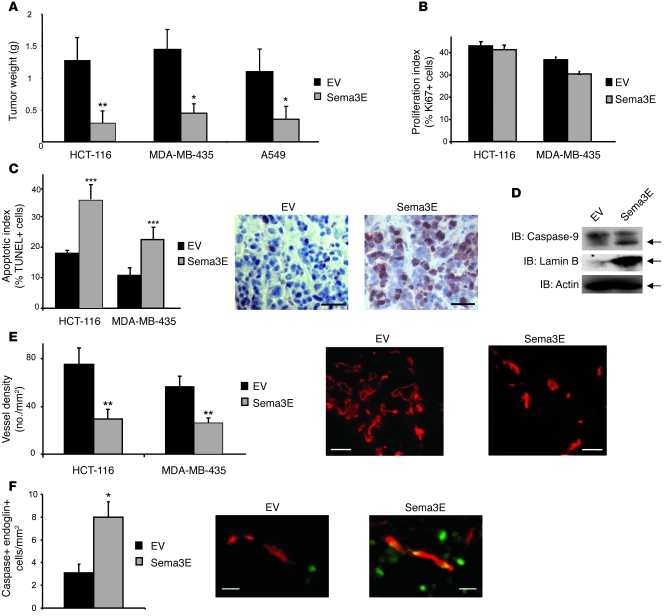
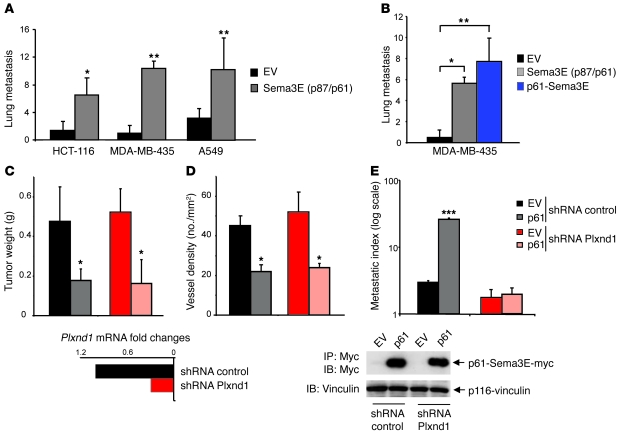
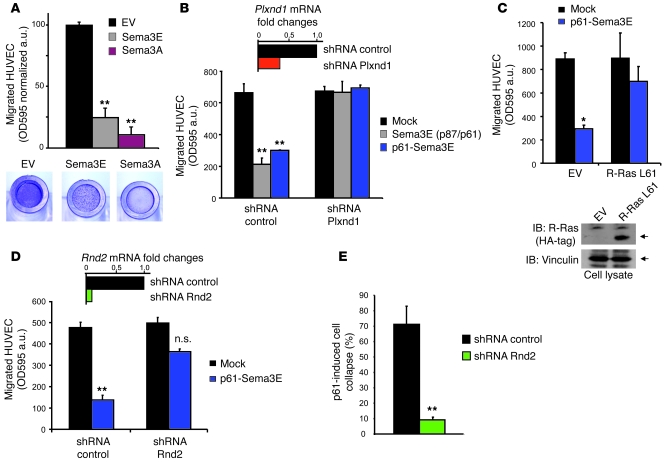
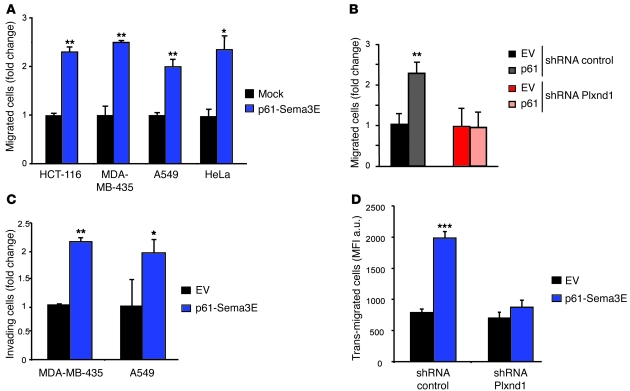
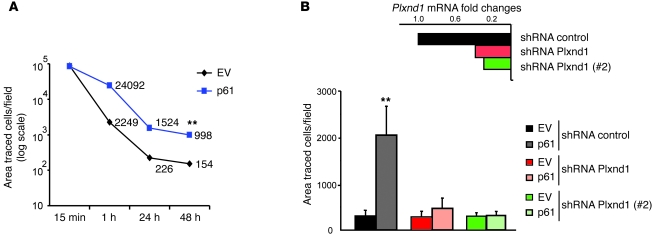
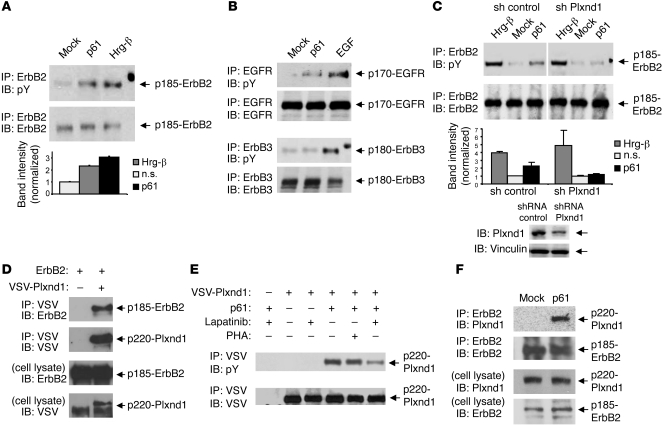
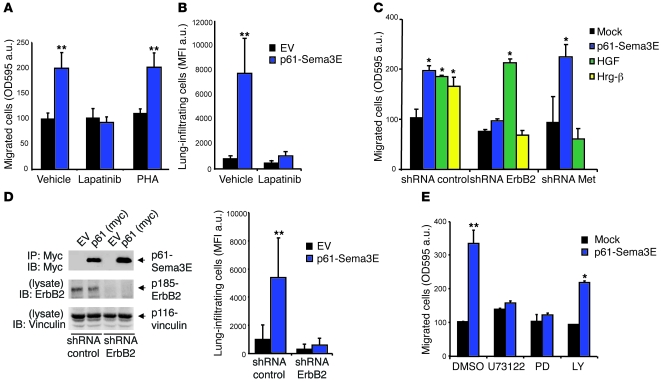
Semaphorin 3E (Sema3E) is a secreted molecule implicated in axonal path finding and inhibition of developmental and postischemic angiogenesis. Sema3E is also highly expressed in metastatic cancer cells, but its mechanistic role in tumor progression was not understood. Here we show that expression of Sema3E and its receptor Plexin D1 correlates with the metastatic progression of human tumors. Consistent with the clinical data, knocking down endogenous expression of either Sema3E or Plexin D1 in human metastatic carcinoma cells hampered their metastatic potential when injected into mice, while tumor growth was not markedly affected. Conversely, overexpression of exogenous Sema3E in cancer cells increased their invasiveness, transendothelial migration, and metastatic spreading, although it inhibited tumor vessel formation, resulting in reduced tumor growth in mice. The proinvasive and metastatic activity of Sema3E in tumor cells was dependent on transactivation of the Plexin D1-associated ErbB2/Neu oncogenic kinase. In sum, Sema3E-Plexin D1 signaling in cancer cells is crucially implicated in their metastatic behavior and may therefore be a promising target for strategies aimed at blocking tumor metastasis.


Figures

Figure 1
Figure 1. Elevated Sema3E expression in invasive human melanomas.
(AF) Sema3E expression was detected by immunohistochemistry in a series of 58 nevi and melanoma human samples, representing different stages of progression. Micrographs show representative fields of Sema3E-expressing samples: (A) an intradermal nevus, (B) a dysplastic nevus, (C) a Clark III level malignant melanoma, and (D and E) 2 different Clark IV level melanomas. (F) Control staining of a Clark IV melanoma, without including the specific antibody. Scale bar: 40 μm. (G) In the graph, each case is represented by a blue bar, indicating the fraction of Sema3E-positive cells in the sample (scored as described in Methods). Black bars indicate the mean value for each of 5 groups (intradermal-junctional nevi [nevi], dysplastic nevi/melanomas in situ [dyspl.], and Clark II, Clark III, and Clark IV level melanomas).
Figure 2
Figure 2. Plexin D1 and Sema3E knockdown in tumor cells inhibits the metastatic spreading.
(AC) A549 carcinoma cells were transduced to stably express shRNAs targeting Plexin D1 (or unrelated control sequences), and the expression knockdown was verified by Q-PCR (data not shown) and (A) Western blotting. Plexin D1–deficient and control cells were then transplanted into nude mice to establish subcutaneous tumors. Throughout the graphs, (B, E, H, and J) display the growth of primary tumors and (C, F, I, and K) the number of spontaneous lung metastases scored at the end of the experiment. Data are given as average ± SD of 6 mice for each experimental group throughout. (C) **P < 0.005. (DF) A549 cells were transduced to stably express shRNAs targeting Sema3E (or unrelated control sequences), and gene knockdown was verified by Q-PCR (data not shown) and (D) Western blotting. **P < 0.003. The expression of a second independent shRNA targeting Sema3E yielded similar results (see Supplemental Figure 2, A and B). (GI) Analogous experiment as above, using Sema3E-depleted 4T1 cells injected subcutaneously into syngenic Balb/c mice. **P < 0.007. (J and K) The same Sema3E-depleted 4T1 cells as above were injected orthotopically in the fat pad of Balb/c mice. Data are given as the average ± SD of 6 mice for each experimental group. **P < 0.003. (L) The same Sema3E-deficient 4T1 cells (as in GK) were directly injected intravenously in Balb/c mice, and the number of lung metastatic colonies was evaluated as above. **P < 0.004.
Figure 3
Figure 3. Sema3E overexpression inhibits tumor vessel density and tumor growth.
(A) Sema3E-overexpressing and EV-control cancer cells of different histotypes were transplanted subcutaneously in nude mice. The growth of primary tumors was followed by external measuring (shown in Supplemental Figure 4B). Values in the graph indicate tumor weight at the end of the experiment. Data shown represent the average ± SD of 6 mice per each experimental condition. *P < 0.01; **P < 0.005. (B) Control (EV) and Sema3E-expressing tumor sections (as indicated) were immunostained to detect Ki-67 proliferation marker. The graph indicates the percentage of KI-67–positive cells (average ± SD). (C) Tumor sections (as above) were analyzed to reveal apoptotic cells by TUNEL. Data in the graph show the percentage of TUNEL-positive cells (average ± SD). ***P < 0.001. Two representative fields of HCT-116 tumors are shown. Nuclei were visualized by hematoxylin. Scale bar: 30 μm. (D) Western blot analyses, revealing 2 different apoptotic markers in lysates of Sema3E-expressing tumors, i.e., cleaved caspase-9 and the presence of lamin B in the cytosolic fraction. (E) Tumor sections were stained with anti-CD31 to reveal endothelial cells (in red). Values in the graph indicate the vessel density (average ± SD). **P < 0.005. Scale bar: 40 μm. (F) Apoptotic endothelial cells in tumors were identified by double staining with endoglin (red) and activated caspase-3 (green) markers. *P < 0.02. Scale bar: 10 μm.
Figure 4
Figure 4. Sema3E-p61 signaling in cancer cells enhances the metastatic spreading.
(A) Superficial metastases in the lungs of mice bearing subcutaneous tumor xenografts formed by control or Sema3E-expressing HCT-116, MDA-MB-435, or A549 cells. Data on primary tumors are displayed in Figure 3 and Supplemental Figure 4B. The graph indicates average values ± SD of 6 mice per each experimental condition throughout the figure. *P < 0.04; **P < 0.005. (B) As above, we scored lung metastases in mice transplanted with MDA-MB-435 cancer cells expressing either processable Sema3E (largely converted into p61 in vivo) or the truncated recombinant p61 isoform. Data on primary tumors are shown in Supplemental Figure 5, C–E. *P < 0.02; **P < 0.005. (CE) Plexin D1–deficient MDA-MB-435 cancer cells (or controls), either expressing p61-Sema3E or EV (expression analysis is shown on the bottom) were injected subcutaneously in nude mice to form tumor xenografts. (C) Primary tumors carrying p61-Sema3E grew significantly less compared with controls and (D) displayed a reduced vessel density, independently from the expression of Plexin D1 in cancer cells, thereby suggesting a paracrine activity of the semaphorin in the microenvironment. (E) Conversely, p61 expression could not induce the metastatic spreading of tumor cells devoid of Plexin D1. *P < 0.05; ***P < 0.0005.
Figure 5
Figure 5. Molecular mechanisms of Sema3E-dependent endothelial cell repulsion.
(A) The haptotactic migration of HUVECs was analyzed in the presence of 7 nM purified Sema3E (or equal concentration of Sema3A, as positive control) in the lower chamber. Migrated cells were stained with crystal violet and quantified by absorbance at 595 nm (see Methods for details). The graphs show the average ± SD of at least 2 independent experiments throughout the figure. **P < 0.005. See also Supplemental Figure 6, A and B. (B) Plexin D1 expression was knocked down in HUVECs (verified by Q-PCR), and the haptotactic migration of these cells was assayed in Transwell inserts. Both processable wild-type Sema3E (yielding a p87/p61 mix) and the recombinant p61-Sema3E fragment (7 nM each) inhibited the migration of controls but not of Plexin D1–deficient cells. Migrated cells were quantified by staining with crystal violet and measuring absorbance at 595 nm (see Methods). Data are given as average ± SD of 2 different experiments. **P < 0.005. (C) HUVEC migration assay as above, upon expression of dominant-activated R-Ras-L61 mutant (verified by Western blotting). *P < 0.02. (D) Rnd2 expression was knocked down in HUVECs by siRNA transfection (verified by Q-PCR), and cell migration was assayed as above. **P < 0.005. (E) Rnd2-depleted HUVECs (same as above) were incubated with 7 nM p61-Sema3E for 4 hours, then fixed and stained with FITC-Phalloidin. The percentage of collapsed cells (defined as having a diameter shorter than 30 μm) is indicated on the graph. Data are representative of at least 3 experiments, displaying consistent results. **P < 0.005.
Figure 6
Figure 6. p61-Sema3E induces tumor cell migration and invasiveness.
(A) The migration of the 4 indicated tumor cell lines was assayed in Transwell inserts in response to purified 7 nM p61-Sema3E (included in the lower chamber). Migrated cells were quantified by staining with crystal violet (see Methods). Data are given as average ± SD of at least 2 different experiments and values were normalized to respective controls. *P < 0.03; **P < 0.005. (B) MDA-MB-435 cells transduced with p61-Sema3E or EV and subjected to Plexin D1 knockdown by RNAi (the same as in Figure 4, C–E). Cell migration was assessed as above, and data were normalized to EV-shRNA control. **P < 0.005. Analogous results were obtained with HCT-116 cells (data not shown). (C) MDA-MB-435 or A549 tumor cells were added in the upper chamber of a Transwell insert coated with Matrigel and allowed to invade the matrix and migrate to the lower side of the porous membrane (quantified as above). Data shown are the average ± SD of 2 different experiments. *P < 0.05; **P < 0.005. (D) We assessed the transmigration of p61-expressing (or control) MDA-MB-435 cells (as in B) through a confluent monolayer of HUVECs (see Methods for experimental details). Tumor cells were labeled with CFDA-SE before the experiment. Transmigrated cells were detected by a fluorescence microscope and quantified using METAMORPH software. The graph shows the MFI ± SD in triplicate samples. p61-Sema3E signaling enhanced the transendothelial migration of tumor cells, whereas this effect was lost in Plexin D1–deficient cells. ***P < 0.0005.
Figure 7
Figure 7. p61-Sema3E enhances cancer cell metastatic extravasation.
(A) MDA-MB-435 cancer cells expressing p61 (as in Figure 6) were fluorescently labeled and injected intravenously in nude mice. Two days later, the number of metastatic fluorescent cells was quantified in 4 lungs for each experimental group (at least 10 independent stereomicroscopic fields each) with METAMORPH software. Data are given as the mean of traced cells per field. **P < 0.005. (B) The same engineered MDA-MB-435 cancer cells shown in Figure 6D, plus 2 additional batches of Plexin D1-depleted cells (expressing an alternative shRNA sequence indicated by “#2”; see RT-PCR analysis on top) were fluorescently labeled and injected intravenously in nude mice. The number of fluorescent cells in the lungs was quantified by analyzing 4 mice for each experimental group (at least 10 independent stereomicroscopic fields each) with METAMORPH software. Data are given as mean of traced cells per field ± SD. The y-axis is in logarithmic scale. **P < 0.005.
Figure 8
Figure 8. p61-Sema3E elicits the activation of Plexin D1–associated tyrosine kinase ErbB2.
(A) A549 tumor cells were starved for 48 hours and stimulated for 15 minutes with 7 nM p61-Sema3E or 0.2 nM Heregulin-β1 ECD (Hrg-β). ErbB2 was immunoprecipitated and analyzed by immunoblotting with anti–phospho-tyrosine (anti-pY) antibodies. The graph shows the average fold change of band intensity ± SD observed in 3 experiments (normalized to controls). (B) As above, serum-starved A549 cells were stimulated for 15 minutes with 7 nM p61 or 1 nM EGF. Then, EGFR or ErbB3 were immunoprecipitated using appropriate antibodies and analyzed with anti–phospho-tyrosine antibodies. (C) In analogy to the above experiments, ErbB2 phosphorylation in response to p61 or Hrg-β was assayed in HeLa carcinoma cells, either control or Plexin D1 depleted (verified by Western blot analysis). The graph shows the average fold change of band intensity ± SD observed in 3 experiments. (D) Plexin D1 (VSV-tagged) and ErbB2, transfected into HEK293 cells, coprecipitate in a specific complex, as revealed by immunoblotting. Analogous results were obtained upon transfection in COS cells (data not shown). The experiment was repeated 3 times with consistent results. (E) COS cells transfected with VSV-tagged Plexin D1 were preincubated with either 200 nM Lapatinib, or 250 nM PHA-665752 (PHA), or vehicle, for 3 hours. Thereafter, cells were treated for 15 minutes with 7 nM p61 or mock stimulated. Plexin D1 was immunoprecipitated and analyzed with anti–phospho-tyrosine antibodies. (F) Serum-starved A549 cancer cells, expressing endogenous Plexin D1 and ErbB2 receptors, were treated with mock or 7 nM p61-Sema3E for 10 minutes. Plexin D1 copurifying with ErbB2 was revealed by immunoblotting.
Figure 9
Figure 9. ErbB2 kinase is required for p61-dependent promigratory and prometastatic function.
(A) A549 cells were pretreated with 400 nM Lapatinib or 250 nM PHA-665752 for 2 hours and allowed to migrate in a Transwell insert in response to 7 nM p61-Sema3E in presence of the same inhibitors. Migrated cells were quantified by staining with crystal violet (see Methods). Data are given as average ± SD of 2 independent experiments. **P < 0.005. Analogous results were obtained by analyzing MDA-MB-435 and HeLa cancer cells (see Supplemental Figure 11, A and B). (B) A549 cells were transduced to establish an autocrine circuit of p61-Sema3E, fluorescence labeled with CFDA-SE, and injected systemically into mice treated with Lapatinib or vehicle (see Methods). Forty-eight hours after injection, metastatic fluorescent cells in the lungs were quantified (as described in Methods). The graph indicates average values ± SD of 5 mice per each experimental group. **P < 0.003. (C) The expression of ErbB2 (or Met tyrosine kinase as control) was knocked down in A549 tumor cells by RNAi (see Methods) and migration was assayed as above in response to 7 nM p61, 1 nM Hrg-β, or 1 nM HGF. Data are given as average ± SD of 2 independent experiments. Statistical significance was calculated relative to mock-treated cells in each group. *P < 0.05. (D) ErbB2-depleted A549 cells and respective controls were transduced to establish an autocrine circuit of p61-Sema3E (see expression analysis). Tumor cells were labeled with CFDA-SE before intravenous injection into nude mice. The graph shows the number of metastatic cells infiltrating the lungs after 48 hours, quantified as in B (average values ± SD of 5 mice per each experimental group). **P < 0.005. (E) Sema3E-induced migration of A549 cells was assayed as above, in the presence of DMSO (vehicle), or 2 μm U73122 (PLCγ), 10 μm PD98059 (“PD,” MAPK inhibitor), or 10 μm LY294002 (“LY,” PI3K inhibitor). PLCγ close to U73122; (MAPK inhibitor) close to PD98059, and (AKT inhibitor) close to LY294002. Data are given as average ± SD of 2 independent experiments. *P < 0.05, **P < 0.003.

Comment in

  • Semaphorin 3E, an exception to the rule.
    Klagsbrun M, Shimizu A. Klagsbrun M, et al. J Clin Invest. 2010 Aug;120(8):2658-60. doi: 10.1172/JCI44110. Epub 2010 Jul 26. J Clin Invest. 2010. PMID: 20664165 Free PMC article.

References

    1. Zhou Y, Gunput RA, Pasterkamp RJ. Semaphorin signaling: progress made and promises ahead. Trends Biochem Sci. 2008;33(4):161–170. doi: 10.1016/j.tibs.2008.01.006. - DOI - PubMed
    1. Tamagnone L, Comoglio PM. Signalling by semaphorin receptors: cell guidance and beyond. Trends Cell Biol. 2000;10(9):377–383. doi: 10.1016/S0962-8924(00)01816-X. - DOI - PubMed
    1. Casazza A, Fazzari P, Tamagnone L. Semaphorin signals in cell adhesion and cell migration: functional role and molecular mechanisms. Adv Exp Med Biol. 2007;600:90–108. - PubMed
    1. Giordano S, et al. The semaphorin 4D receptor controls invasive growth by coupling with Met. Nat Cell Biol. 2002;4(9):720–724. doi: 10.1038/ncb843. - DOI - PubMed
    1. Toyofuku T, et al. Dual roles of Sema6D in cardiac morphogenesis through region–specific association of its receptor, Plexin–A1, with off–track and vascular endothelial growth factor receptor type 2. Genes Dev. 2004;18(4):435–447. doi: 10.1101/gad.1167304. - DOI - PMC - PubMed

Publication types

MeSH terms