. 2010 Dec;18(12):2146-54.
doi: 10.1038/mt.2010.164. Epub 2010 Jul 27.

Induction of immune tolerance to a therapeutic protein by intrathymic gene delivery

Affiliations

Induction of immune tolerance to a therapeutic protein by intrathymic gene delivery

Qiuming Chu et al. Mol Ther. 2010 Dec.

Abstract

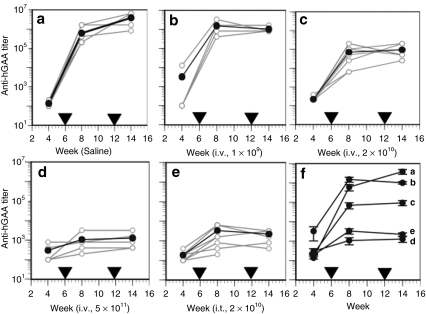
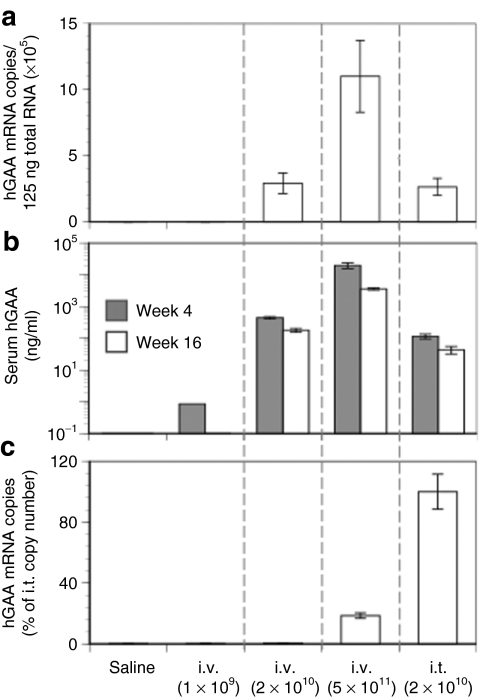
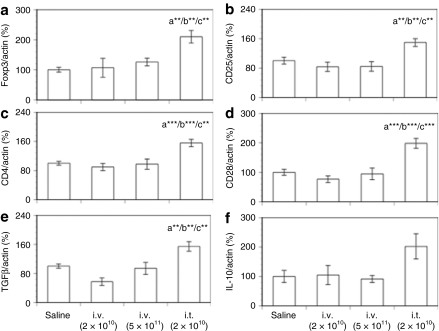
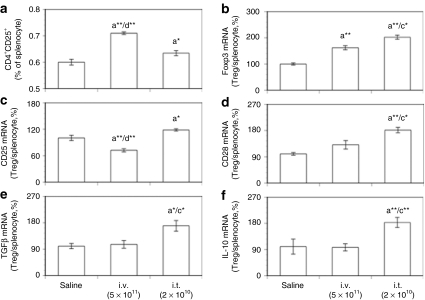
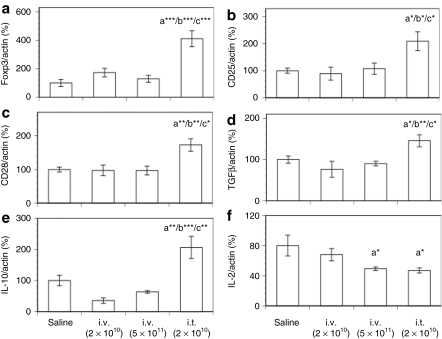
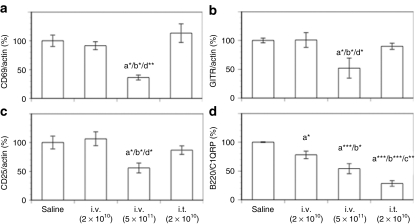
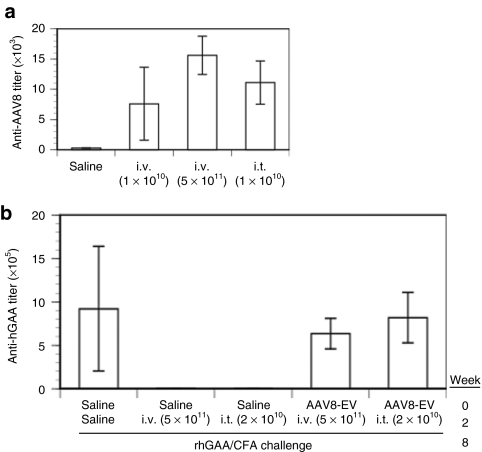
The efficacy of recombinant enzyme therapy for genetic diseases is limited in some patients by the generation of a humoral immune response to the therapeutic protein. Inducing immune tolerance to the protein prior to treatment has the potential to increase therapeutic efficacy. Using an AAV8 vector encoding human acid α-glucosidase (hGAA), we have evaluated direct intrathymic injection for inducing tolerance. We have also compared the final tolerogenic states achieved by intrathymic and intravenous injection. Intrathymic vector delivery induced tolerance equivalent to that generated by intravenous delivery, but at a 25-fold lower dose, the thymic hGAA expression level was 10,000-fold lower than the liver expression necessary for systemic tolerance induction. Splenic regulatory T cells (Tregs) were apparent after delivery by both routes, but with different phenotypes. Intrathymic delivery resulted in Tregs with higher FoxP3, TGFβ, and IL-10 mRNA levels. These differences may account for the differences noted in splenic T cells, where only intravenous delivery appeared to inhibit their activation. Our results imply that different mechanisms may be operating to generate immune tolerance by intrathymic and intravenous delivery of an AAV vector, and suggest that the intrathymic route may hold promise for decreasing the humoral immune response to therapeutic proteins in genetic disease indications.


Figures

Figure 1
Figure 1
Anti-hGAA antibody profiles before and after rhGAA protein challenges in mice receiving AAV8-hGAA by intravenous or intrathymic delivery. Mice were treated (week zero) with (a) saline by intravenous (N = 5) or intrathymic (N = 3) injection, or the AAV8-hGAA vector by intravenous (i.v.) injection at (b) 1 × 10⁹ (N = 4), (c) 2 × 10¹⁰ (N = 7), or (d) 5 × 10¹¹ DNase-resistant particles (drp) (N = 5), or (e) intrathymic (i.t.) injection at 2 × 10¹⁰ drp (N = 9). Mice were challenged with rhGAA in complete Freund's adjuvant at week 6 after AAV administration and with rhGAA in incomplete Freund's adjuvant at week 12, as indicated by the arrowheads. Anti-hGAA titers were analyzed at weeks 4, 8 (2 weeks after the 1st challenge), and 14 (2 weeks after the 2nd challenge). Open circles connected by gray lines represent anti-hGAA titers for individual mice. Filled circles connected by dark lines represent average values for each group, which are shown compiled in f with SEM.
Figure 2
Figure 2
hGAA levels in liver, serum, and thymus after intravenous or intrathymic injection of AAV8-hGAA. Mice received different doses of the AAV8-hGAA vector by intravenous or intrathymic injection as in Figure 1. (a) Liver expression of the transgene was quantified at week 16 after AAV administration by hGAA mRNA copies. (b) Serum hGAA levels were determined by enzyme-linked immunosorbent assay at weeks 4 and 16, and (c) thymic expression was quantified at week 16 by hGAA mRNA copies. Data are expressed as means ± SEM (N = 8–10 mice/group).
Figure 3
Figure 3
Thymic mRNA levels of Foxp3, CD markers, and cytokines after intravenous or intrathymic injection of AAV8-hGAA. Thymic mRNA expression levels of (a) Foxp3, (b) CD25, (c) CD4, (d) CD28, (e) TGFβ, and (f) IL-10 were analyzed by TaqMan with preamplification (see Materials and Methods) at week 16 after AAV8-hGAA administration. Results shown are normalized to actin expression and expressed as a percentage of the saline control, and are presented as means ± SEM (N = 8–10 mice/group). Above a bar, the letter “a” represents a significant difference compared to the saline group, “b” compared to the i.v. (2 × 10¹⁰) group, and “c” compared to the i.v. (5 × 10¹¹) group. The number of asterisks following the letter denote the level of statistical significance: **P < 0.01, ***P < 0.001.
Figure 4
Figure 4
mRNA levels of Foxp3, CD markers, and cytokines by isolated CD4+CD25+ Tregs after intravenous or intrathymic injection of AAV8-hGAA. CD4+CD25+ Tregs were isolated from mouse spleen. mRNA expression by isolated CD4+CD25+ Tregs and total spleen cells at week 16 after AAV8-hGAA administration was analyzed by TaqMan with preamplification. (a) The percent of total spleen cells that are CD4+CD25+ (Tregs). Expression of mRNAs for (b) Foxp3, (c) CD25, (d) CD28, (e) TGFβ, and (f) IL-10 by these CD4+CD25+ cells relative to the corresponding mRNA in total splenocytes, normalized to actin mRNA and depicted as a percentage of the saline control. Data are shown as means ± SEM (N = 8–10 mice/group). Above a bar, the letter “a” represents a significant difference compared to the saline group, “c” compared to the i.v. (5 × 10¹¹) group, and “d” compared to the i.t. (2 × 10¹⁰) group. The number of asterisks following the letter denote the level of statistical significance: *P < 0.05, **P < 0.01.
Figure 5
Figure 5
Liver mRNA levels of Foxp3, CD markers, and cytokines after intravenous or intrathymic injection of AAV8-hGAA. Liver mRNA expression levels of (a) Foxp3, (b) CD25, (c) CD28, (d) TGFβ, (e) IL-10, and (f) IL-2 were analyzed by TaqMan with preamplification at week 16 after administration of AAV8-hGAA. Results shown are normalized to actin expression and expressed as a percent of the saline control, and are presented as means ± SEM (N = 8–10 mice/group). Above a bar, the letter “a” represents a significant difference compared to the saline group, “b” compared to the i.v. (2 × 10¹⁰) group, and “c” compared to the i.v. (5 × 10¹¹) group. The number of asterisks following the letter denote the level of statistical significance: *P < 0.05, **P < 0.01, ***P < 0.001.
Figure 6
Figure 6
Splenic mRNA levels of T- and B-cell markers after intravenous or intrathymic injection of AAV8-hGAA. Splenic mRNA expression levels of (a) CD69, (b) GITR, (c) CD25, and (d) B220/C1QRP were analyzed by TaqMan with preamplification at week 16 after administration of AAV8-hGAA. Results shown are normalized to actin expression and expressed as a percentage of the saline control, and are presented as means ± SEM (N = 8–10 mice/group). Above a bar, the letter “a” represents a significant difference compared to the saline group, “b” compared to the i.v. (2 × 10¹⁰) group, “c” compared to the i.v. (5 × 10¹¹) group, and “d” compared to the i.t. (2 × 10¹⁰) group. The number of asterisks following the letter denote the level of statistical significance: *P < 0.05, **P < 0.01, ***P < 0.001.
Figure 7
Figure 7
Antibody responses in naive and preimmunized mice receiving AAV8-hGAA by intravenous or intrathymic injection. (a) Antibody titers against AAV8 were determined in naive mice 2 weeks after receiving saline or AAV8-hGAA by intravenous delivery of 1 × 10¹⁰ or 5 × 10¹¹ DNase-resistant particles (drp) or intrathymic delivery of 2 × 10¹⁰ drp. (b) Antibody titers against hGAA were determined at week 10 in (i) mice given intravenous saline at week 0, given 5 × 10¹¹ drp AAV8-hGAA intravenously or 2 × 10¹⁰ intrathymically at week 2, and then challenged at week 8 with rhGAA in complete Freund's adjuvant (CFA), and (ii) mice preimmunized with 1× 10¹⁰ drp AAV8-EV at week 0, given 5 × 10¹¹ drp AAV8-hGAA intravenously or 2 × 10¹⁰ intrathymically at week 2 and then challenged at week 8 with rhGAA in CFA. Data are expressed as means ± SEM (N = 5 mice/group).

References

    1. Joseph A, Munroe K, Housman M, Garman R., and, Richards S. Immune tolerance induction to enzyme-replacement therapy by co-administration of short-term, low-dose methotrexate in a murine Pompe disease model. Clin Exp Immunol. 2008;152:138–146. - PMC - PubMed
    1. Kishnani PS, Goldenberg PC, DeArmey SL, Heller J, Benjamin D, Young S, et al. Cross-reactive immunologic material status affects treatment outcomes in Pompe disease infants. Mol Genet Metab. 2010;99:26–33. - PMC - PubMed
    1. Ziegler RJ, Bercury SD, Fidler J, Zhao MA, Foley J, Taksir TV, et al. Ability of adeno-associated virus serotype 8-mediated hepatic expression of acid alpha-glucosidase to correct the biochemical and motor function deficits of presymptomatic and symptomatic Pompe mice. Hum Gene Ther. 2008;19:609–621. - PubMed
    1. Zhu Y, Jiang JL, Gumlaw NK, Zhang J, Bercury SD, Ziegler RJ, et al. Glycoengineered acid alpha-glucosidase with improved efficacy at correcting the metabolic aberrations and motor function deficits in a mouse model of Pompe disease. Mol Ther. 2009;17:954–963. - PMC - PubMed
    1. Chu Q, Joseph M, Przybylska M, Yew NS., and, Scheule RK. Transient siRNA-mediated attenuation of liver expression from an alpha-galactosidase A plasmid reduces subsequent humoral immune responses to the transgene product in mice. Mol Ther. 2005;12:264–273. - PubMed

MeSH terms

Substances