. 2010 Nov;3(6):578-93.
doi: 10.1038/mi.2010.41. Epub 2010 Jul 21.

TLR4/MyD88-induced CD11b+Gr-1 int F4/80+ non-migratory myeloid cells suppress Th2 effector function in the lung

Affiliations

TLR4/MyD88-induced CD11b+Gr-1 int F4/80+ non-migratory myeloid cells suppress Th2 effector function in the lung

M Arora et al. Mucosal Immunol. 2010 Nov.

Erratum in

  • Mucosal Immunol. 2011 Jan;4(1):124

Abstract

In humans, environmental exposure to a high dose of lipopolysaccharide (LPS) protects from allergic asthma, the immunological underpinnings of which are not well understood. In mice, exposure to a high LPS dose blunted house dust mite-induced airway eosinophilia and T-helper 2 (Th2) cytokine production. Although adoptively transferred Th2 cells induced allergic airway inflammation in control mice, they were unable to do so in LPS-exposed mice. LPS promoted the development of a CD11b(+)Gr1(int)F4/80(+) lung-resident cell resembling myeloid-derived suppressor cells in a Toll-like receptor 4 and myeloid differentiation factor 88 (MyD88)-dependent manner that suppressed lung dendritic cell (DC)-mediated reactivation of primed Th2 cells. LPS effects switched from suppressive to stimulatory in MyD88(-/-) mice. Suppression of Th2 effector function was reversed by anti-interleukin-10 (IL-10) or inhibition of arginase 1. Lineage(neg) bone marrow progenitor cells could be induced by LPS to develop into CD11b(+)Gr1(int)F4/80(+)cells both in vivo and in vitro that when adoptively transferred suppressed allergen-induced airway inflammation in recipient mice. These data suggest that CD11b(+)Gr1(int)F4/80(+) cells contribute to the protective effects of LPS in allergic asthma by tempering Th2 effector function in the tissue.


Conflict of interest statement

Disclosure: The authors declare no conflict.

Figures

Figure 1
Figure 1
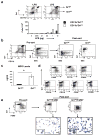
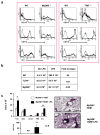
LPS administration increases the frequency of CD11b+Gr1+F4/80+ cells in the lung. Lung cells were isolated by enzymatic digestion of lung tissue. The cells were stained with anti-CD11b and anti-Gr1 monoclonal antibodies and were analyzed by flow cytometry. The forward versus side light scatter pattern revealed a distinct non-lymphocytic population of cells where CD11b-expressing and Gr1-expressing cells were concentrated (data not shown). This population of cells was gated upon for subsequent analyses. (a) Expression of CD11b and Gr1 on lung cells measured by flow cytometry with or without LPS treatment of mice (upper panels). The numbers of CD11b+ cells expressing high (hi) or intermediate (int) levels of Gr1 were determined in response to increasing concentrations of LPS per treatment (lower panel). (b) Two populations of CD11b+ cells from the lungs of LPS-treated mice were sorted based upon expression of intermediate (Gr1int) or high (Gr1hi) levels of Gr1. The purity of Grint and Grhi populations was more than 95%. (c) Levels of MPO in the supernatants of Grint and Grhi populations were detected using an ELISA kit for MPO. *, P<0.05. (d) Expression of F4/80, CD11c, CD124, CD115, CD62L, CD34 and CD206 on the LPS-induced CD11b+Grint cells by flow cytometry. Cursors are placed based on staining with isotype control antibodies. (e) CD11b+ cells isolated from the lungs of LPS-treated mice were sorted based upon expression of Gr1 and F4/80 (upper panels). The purity of CD11b+Gr1intF4/80+ and CD11b+Gr1hiF4/80- cells was >94%. Cytospin slides were prepared and stained using the 3-Step Stain kit (Richard-Allan Scientific). CD11b+/Gr1hi/F4/80- cells were identified as neutrophils with characteristic lobular-shaped nuclei. The CD11b+Gr1int/F4/80+ cells appeared to be a heterogeneous population with the majority containing ring-shaped nuclei (inset) (lower panels). The data are representative of at least three independent experiments.
Figure 2
Figure 2
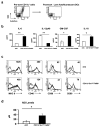
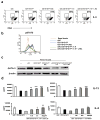
CD11b+Gr1intF4/80+ cells induced by LPS administration are distinct from conventional lung DCs. (a) CD11c+ cells were purified from the lung cells obtained from LPS-treated mice. Conventional DCs were identified as CD11c+ cells with a relatively low level of autofluorescence and side scatter and were used as APCs in experiments where needed. The purity of these cells was more than 95%. (b) 2×10⁵ cells (cDCs or CD11b+Gr1intF4/80+ cells) were plated for 20 h and culture supernatants were analyzed for cytokine production. Values shown are mean ± SEM, *, P<0.01, **, P< 0.001. (c) Expression of co-stimulatory molecules detected by flow cytometry on the cDC and CD11b+Gr1int F4/80+ populations. Dark lines represent expression of the indicated molecules, the light lines being background fluorescence determined by staining with appropriate isotype control antibodies. (d) Levels of NO in the supernatants of cell cultures. DC and Gr1int/F4/80+ were isolated from the same LPS-treated mice as described before. Data shown are representative of two independent experiments and depict mean ± SD *, P<0.05.
Figure 3
Figure 3
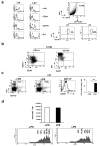
The CD11b+Gr1int cells do not migrate to the lung-draining lymph nodes and LPS instillation in the lung does not inhibit CD4+ T cell proliferation in the LNs. (a) The lin- population in bone marrow cells was enriched using a lineage depletion kit and phenotypic analysis was performed by flow cytometry. Also, shown is the phenotypic analysis of the lin+ fraction. The lin- population of bone marrow cells was enriched from EGFP transgenic mice and transferred intravenously (i.v.) into naïve mice. Mice were divided into two groups and one group then received three daily treatments of 10μg LPS while the other group was left untreated. The top right panel shows the presence of GFP+ cells in the lung after transfer of GFP+ lin- cells. The forward versus side light scatter pattern revealed a distinct non-lymphocytic population of cells where CD11b- and Gr1-expressing cells were concentrated (data not shown). This population of cells was gated on for subsequent analyses. Within the GFP gate, the percentage of cells expressing intermediate (int) levels of Gr1 were determined in the presence or absence of LPS (lower panel). (b) CD11c+ and CD11b+ cells were purified from the lung cells obtained from LPS-treated mice. Expression of CCR7 on low autofluorescent CD11c+ and CD11b+ cells was detected by flow cytometry. (c) Expression of CD11b and Gr1 on LN cells measured by flow cytometry with or without LPS treatment of mice. The histogram shows CCR7 levels on CD11c+ cells obtained from LN cells of LPS-treated mice. Thin gray lines indicate staining with appropriate isotype control antibody and the overlay represents expression of the CCR7 molecules. The last panel shows a ∼30-fold increase in the number of CD11c+Gr1- cells in the LNs in LPS-treated mice. Data represent average values obtained from 3 independent experiments ± SD **, P<0.005. (d) TCR transgenic CD4+ T cells were isolated from the spleens of DO11.10 mice. The cells were labeled with CFSE and adoptively transferred to either naïve or LPS-treated mice (four daily treatments with 10 μg/treatment of LPS). Beginning one day after adoptive transfer, the mice received OVA/CT once per day for 2 d. 24 h later, the number of KJ-126+ (DO11.10), CFSE-expressing cells in the lung-draining lymph nodes was determined (upper panel), and the degree of cell proliferation was quantitated based upon CFSE dilution (lower panels). Results shown are representative of two independent experiments.
Figure 4
Figure 4
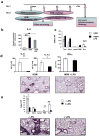
Suppression of HDM- and TH2 cell-induced eosinophilic inflammation in the airways by LPS. (a) Diagram of the treatment protocol. HDM (100 μg per mouse) ± LPS (10 μg LPS per mouse) was administered intratracheally (i.t.) at the indicated time points. Lung-draining LNs were harvested from one group 7 days after one HDM instillation ± LPS to assess CD4+ T cell priming. The rest of the animals were challenged with HDM ± LPS and at 72 h after the final instillation, BAL fluid and lung tissue samples were obtained. (b) ELISPOT assay of cells harvested from lung-draining LNs. Naive mice were used as control. For all the groups, the total cell population was used for ELISPOT assay and the number of cytokine-expressing Th cells was estimated based upon the percentage of CD4+ T cells determined by flow cytometry. For the HDM and HDM+LPS groups, CD4+ T cells were also purified by magnetic bead selection prior to being subjected to the assay to confirm that the cytokines were being produced by CD4+ T cells. In all cases, cells were stimulated for 8-10 h with PMA (25 ng/ml) plus ionomycin (500 ng/ml). Results are expressed as the number of cytokine-producing cells per sample. Data shown are mean ± SD **, P <0.01. The data shown are representative of two independent experiments. (c) Counts of cells recovered in the BAL fluid. Values are mean + SEM ***, P<0.005. (d) The concentrations of IL-5, IL-13 and IFN-g in lung homogenates were measured by multiplex assay and are presented as mean ± SEM *, P<0.05 and **, P<0.01. Histological examination of lung sections stained with PAS for assessment of inflammation and mucus production. Lung infiltrates around bronchovascular bundles where eosinophilic response is most pronounced in disease were of +4 grade in animals that received HDM and +1/2 in those that received LPS together with HDM. Arrows indicate mucus staining. The data shown are representative of three independent experiments. (e) Th2 cells were generated in vitro using CD4+ T cells from DO11.10 mice and were injected i.v. into either LPS-treated mice or naïve recipient mice (5 × 10⁶ cells/mouse). The mice were then exposed to aerosolized OVA daily for 7 days and were analyzed 24 h after the last exposure. Total and differential counts of cells recovered in the BAL fluid (upper panel) and H&E staining of lung sections (lower panels) of both group of mice were performed. Values are mean ± SEM *, P<0.01 and **, P<0.001. The data shown are representative of two independent experiments.
Figure 5
Figure 5
MyD88-dependence of development of CD11b+Gr1int cells. (a) Bone marrow cells were cultured with GM-CSF and LPS for 9 days and phenotypic analysis was performed using flow cytometry. The resulting cells from wild-type Balb/c mice were compared to those from MyD88-deficient (MyD88-/-) mice (left-hand panel), and those from wild-type C57BL/6 mice were compared to TRIF-deficient (TRIF-/-) mice (right-hand panel). (b) Estimation of fold-induction of CD11b+Gr1int cells in response to LPS in the lungs of WT, TLR4-/- and MyD88-/- mice. (c) MyD88 -/- mice received HDM ± LPS i.t. as in Figure 4a. 72 h after the final instillation, BAL fluid and lung tissue samples were obtained. Total and differential counts of cells recovered in the BAL fluid (left-hand panel) and H&E staining of lung sections (right-hand panels) were performed. Values shown are mean ± SD, *, P<0.05, **, P<0.005. The concentration of IL-5 in lung homogenates was measured by multiplex assay and is presented as mean ± SEM ***, P<0.001. The data shown are representative of two independent experiments.
Figure 6
Figure 6
CD11b+Gr1int cells induced by LPS administration suppress Th2 cell responses. Th2 cells were generated in vitro using CD4+ T cells from DO11.10 mice by incubation under Th2-skewing conditions for 6 days. cDCs and CD11b+Gr1int cells were isolated from the lungs of LPS-treated mice. cDCs and CD11b+Gr1int cells alone (each at 1 × 10⁵ cells/well or at 5 fold more numbers of CD11b+Gr1int cells) or in combination as shown were cultured with Th2 polarized DO11.10 CD4+ T cells (1 × 10⁶ cells/well) and OVA peptide (5 μg/ml). (a) Following cell-surface staining for CD4, intracellular cytokine staining for IL-5 was performed on co-cultured cells after 36 h. Cells were incubated with Golgi Stop (BD Biosciences) for the last 4 h of culture, were fixed with CytoFix/CytoPerm (BD Biosciences), permeabilized with Perm/Wash buffer (BD Biosciences) and labeled with anti-IL-5 mAb. For analysis by flow cytometry, gating on CD4-positive cells revealed a population with lower CD4 expression and blast-like FSC vs SSC properties (not shown), consistent with activated T cells. In each dot plot, the number represents the proportion of IL-5-producing cells (indicated by the box) among activated CD4-positive cells. (b) Cells were stimulated with IL-2 (50 U/ml) for 15 min and STAT5 phosphorylation determined by intracellular staining. (c) Nuclear extracts were analyzed by immunoblotting with antibodies against GATA-3 and β-actin. (d) Reversal of suppression of Th2 (IL-5 and IL-13) cytokine production by Arg 1 inhibitor and anti-IL-10. Culture supernatants were analyzed by multiplex cytokine assay. Data shown are mean ± s.d. * P<0.05, **P<0.01, ***P<0.001 with respect to cDC:CD11b+Gr1int (1:5 ratio).
Figure 7
Figure 7
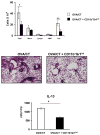
CD11b+Gr1int cell-mediated prevention and treatment of eosinophilic airway inflammation in vivo. Mice were antigen-sensitized by three daily consecutive intranasal treatments with OVA plus cholera toxin (CT) followed by 5 d of rest. CD11b+Gr1int cells were generated from bone-marrow progenitor cells in the presence of GM-CSF (10ng/ml) and LPS (1μg/ml) and then adoptively transferred intratracheally (1 × 10⁶ cells/mouse) into mice that had received OVA/CT. Control mice did not receive any cells. Mice were then challenged with aerosolized OVA daily for 7 d. Total and differential cell counts in the BAL fluid (upper panel) were enumerated. Values are mean ± SEM *, P<0.05 and **, P<0.01. H&E staining (middle panel) of lung sections was performed. Lung infiltrates around bronchovascular bundles were of +5 grade in animals that did not receive CD11b+Gr1int cells and +1 grade in those that did. IL-13 present in lung homogenates (lower panel) was measured by ELISA and presented as the mean value ± SEM *, P < 0.05.

Similar articles

Cited by

References

    1. Strachan DP. Hay fever, hygiene, and household size. Bmj. 1989;299:1259–1260. - PMC - PubMed
    1. Shirakawa T, Enomoto T, Shimazu S, Hopkin JM. The inverse association between tuberculin responses and atopic disorder. Science. 1997;275:77–79. - PubMed
    1. Ball TM, et al. Siblings, day-care attendance, and the risk of asthma and wheezing during childhood. N Engl J Med. 2000;343:538–543. - PubMed
    1. Braun-Fahrlander C, et al. Environmental exposure to endotoxin and its relation to asthma in school-age children. N Engl J Med. 2002;347:869–877. - PubMed
    1. Yabuhara A, et al. TH2-polarized immunological memory to inhalant allergens in atopics is established during infancy and early childhood. Clin Exp Allergy. 1997;27:1261–1269. - PubMed

Publication types

MeSH terms