

doi: 10.1038/ejhg.2010.101.
Epub 2010 Jul 28.
A standardized framework for the validation and verification of clinical molecular genetic tests
Collaborators,
Affiliations
- PMID: 20664632
- PMCID: PMC3002854
- DOI: 10.1038/ejhg.2010.101
Item in Clipboard
A standardized framework for the validation and verification of clinical molecular genetic tests
Eur J Hum Genet.
2010 Dec.
Abstract
The validation and verification of laboratory methods and procedures before their use in clinical testing is essential for providing a safe and useful service to clinicians and patients. This paper outlines the principles of validation and verification in the context of clinical human molecular genetic testing. We describe implementation processes, types of tests and their key validation components, and suggest some relevant statistical approaches that can be used by individual laboratories to ensure that tests are conducted to defined standards.
Figures
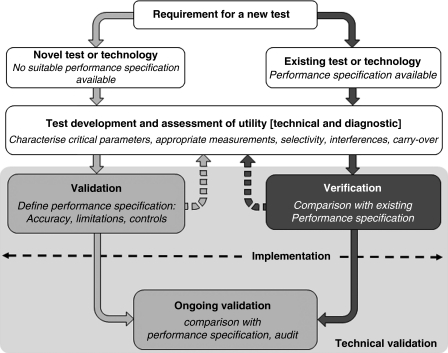
The process of implementing a molecular genetic test for diagnostic use. The shaded arrows represent the two general routes to implementation, depending on the availability of a suitable performance specification: validation (lighter) and verification (darker). Broken arrows represent the situation in which validation or verification fails to meet the specified requirements.
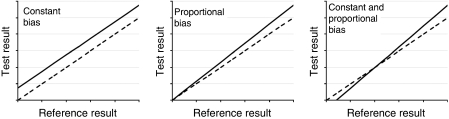
Types of bias. In each case, the broken line represents the perfect result in which all test results are equal to the reference.
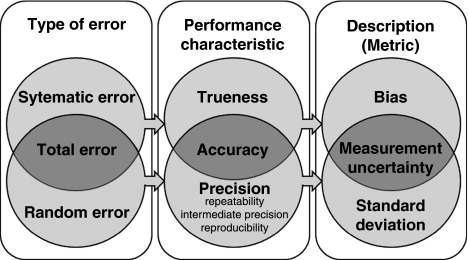
Performance characteristics, error types and measurement metrics used for quantitative tests (adapted from Menditto et al).
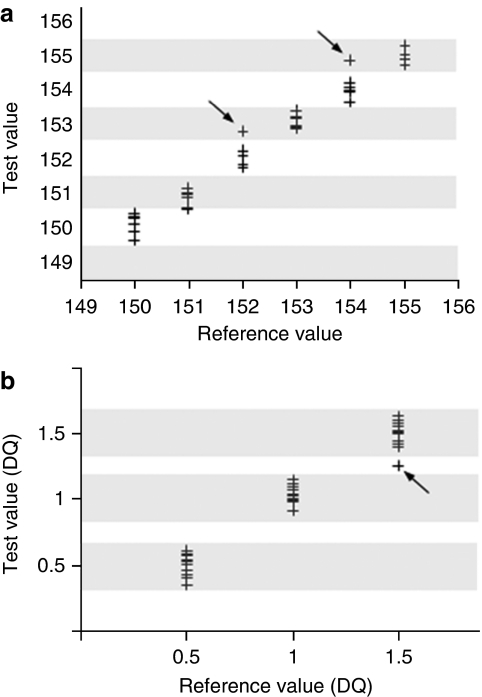
(a) A type-B categorical test to size PCR fragments. Each category (indicated by alternating shading) has an upper cutoff that is also the lower cutoff of the next category. Results marked with arrows are not precise but fall within the given accuracy for the test of ±1 bp. (b) A type-C categorical test for allele quantification. Each category (shaded) has unique upper and lower cutoffs. Results falling between categories are classed as unreportable (marked with an arrow). A dosage quotient (DQ) of 0.5 represents a sample with a deleted allele, 1.0 represents normal and 1.5 represents a sample with a duplicated allele.
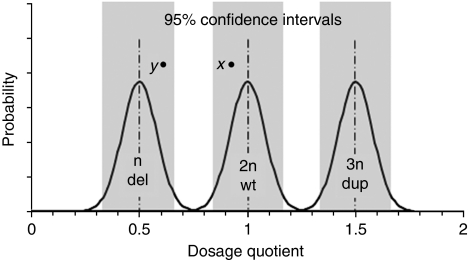
Multiplex ligation-dependent probe amplification to detect exon copy number (Categorical test type C). Dosage quotient (DQ)=relative height of test peak compared with control peaks. DQ=0.5 represents exon deletion, DQ=1.0 represents wild type and DQ=1.5 represents exon duplication. Population distributions of DQs are shown with 95% confidence intervals shaded. Results falling between categories are unreportable.
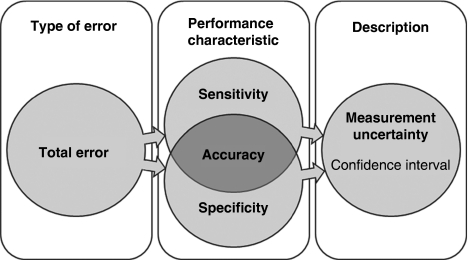
The relationship between performance characteristics, error and measurement uncertainty used for qualitative tests (adapted from Menditto et al).
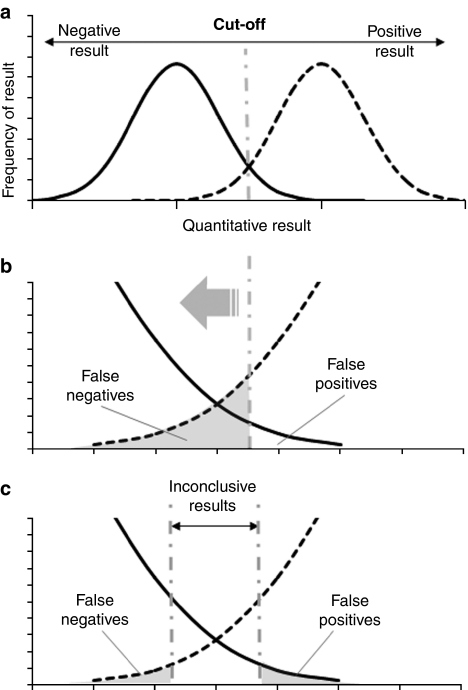
(a) The relationship between sensitivity and specificity. The figure shows frequency distributions of the primary quantitative results for a qualitative (binary) test. Solid line represents gold standard negatives (wild type), broken line represents gold standard positives (mutant). Using a single cutoff to categorize the results as either positive or negative gives rise to both false negatives and false positives. (b) Cutoff location. Positioning the cutoff to the right encompasses more of the negative distribution, giving a low false-positive rate but a high false-negative rate (shaded). As the cutoff is moved to the left, the false-negative rate is reduced but the false-positive rate increases. (c) Use of two cutoffs. It is possible to minimize both false-positive and false-negative rates by using two cutoffs. In this case, results falling between the two cutoffs can either be classified as test failures or be passed for further analysis.
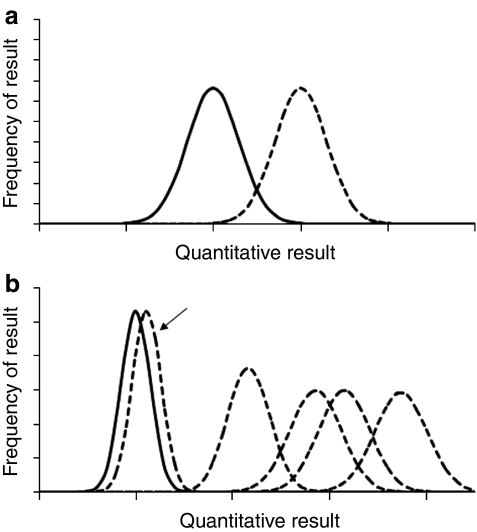
(a) Truly binary test. Only two states of the analyte can be measured: one wild type (solid line) and one mutant (broken line). Competitive hypothesis testing could be used to determine the relative probability (odds ratio) that a result is either wild type or mutant. (b) Arbitrary binary test. There are many different possible states of the analyte; one wild type (solid line) and five different mutants (broken lines) are shown. The mutant state indicated is essentially indistinguishable from the wild type. Hypothesis testing could be used to estimate the probability that a result is not negative, but not that it is not positive.
References
-
- Haddow JE, Palomaki GE.ACCE: a model process for evaluating data on emerging genetic testsin Khoury M, Little J, Burke W (eds): Human Genome Epidemiology: A Scientific Foundation for Using Genetic Information to Improve Health and Prevent Disease Oxford University Press: New York; 2003217–233.
-
- International Organization for Standardization Medical laboratories – Particular requirements for quality and competenceISO 15189:2007
-
- International Organization for Standardization General requirements for the competence of testing and calibration laboratoriesISO/IEC 17025:2005
-
- EuroGentest, EU Contract No.: FP6-512148 , http://www.eurogentest.org .
-
- Jennings L, Van Deerlin VM, Gulley ML. Recommended principles and practices for validating clinical molecular pathology tests. Arch Pathol Lab Med. 2009;133:743–755. - PubMed
Publication types
MeSH terms
Grants and funding
LinkOut - more resources
Full Text Sources
Other Literature Sources
Medical
Molecular Biology Databases
