. 2010 Jul:6:392.
doi: 10.1038/msb.2010.46.

The endocannabinoid system links gut microbiota to adipogenesis

Affiliations

The endocannabinoid system links gut microbiota to adipogenesis

Giulio G Muccioli et al. Mol Syst Biol. 2010 Jul.

Abstract

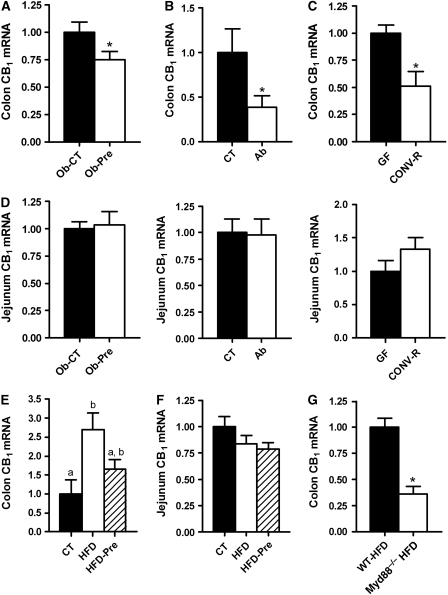
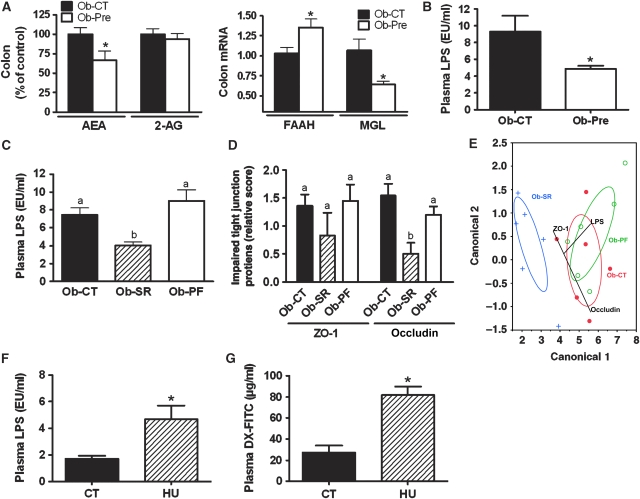
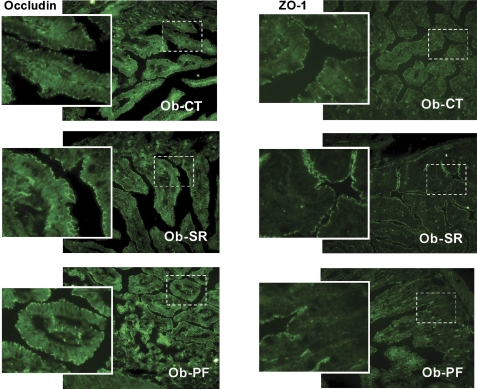
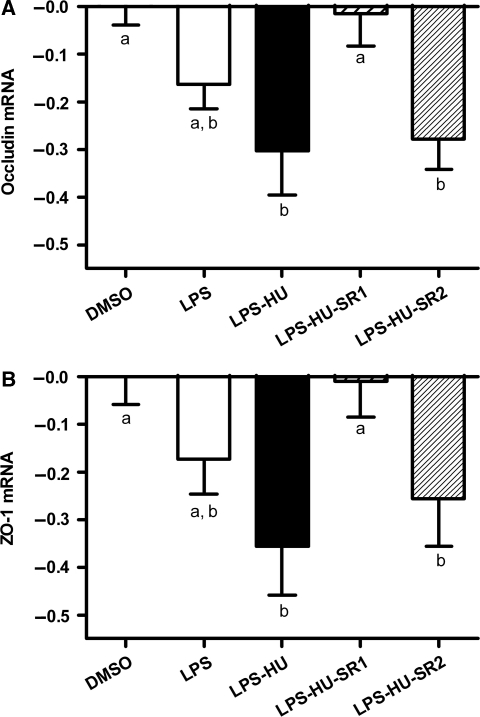
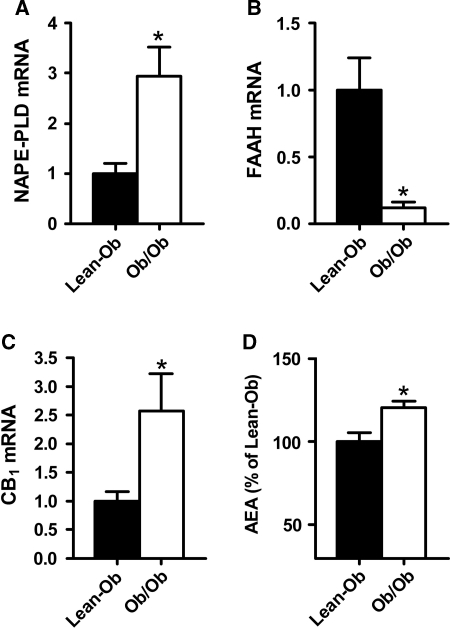
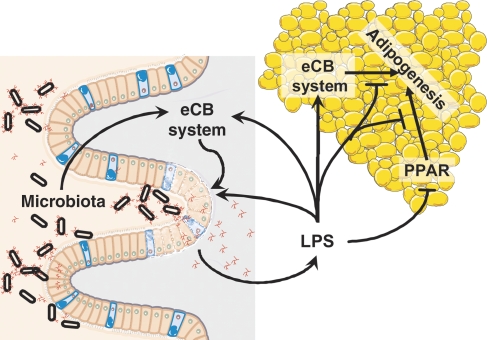
Obesity is characterised by altered gut microbiota, low-grade inflammation and increased endocannabinoid (eCB) system tone; however, a clear connection between gut microbiota and eCB signalling has yet to be confirmed. Here, we report that gut microbiota modulate the intestinal eCB system tone, which in turn regulates gut permeability and plasma lipopolysaccharide (LPS) levels. The impact of the increased plasma LPS levels and eCB system tone found in obesity on adipose tissue metabolism (e.g. differentiation and lipogenesis) remains unknown. By interfering with the eCB system using CB(1) agonist and antagonist in lean and obese mouse models, we found that the eCB system controls gut permeability and adipogenesis. We also show that LPS acts as a master switch to control adipose tissue metabolism both in vivo and ex vivo by blocking cannabinoid-driven adipogenesis. These data indicate that gut microbiota determine adipose tissue physiology through LPS-eCB system regulatory loops and may have critical functions in adipose tissue plasticity during obesity.


Conflict of interest statement

The authors declare that they have no conflict of interest.

Figures

Figure 1
Figure 1
Gut microbiota selectively control colon CB1 mRNA expression. CB1 mRNA levels were selectively altered in the colons of mice according to the gut microbiota–host interaction model tested. (A) Colon CB1 mRNA levels in ob/ob mice fed a normal chow diet (Ob-CT) or treated with prebiotics (Ob-Pre) for 5 weeks (n=10). (B) Colon CB1 mRNA levels in lean wild-type mice (CT) or after antibiotic treatment (Ab) for 2 weeks (n=8–9). (C) Colon CB1 mRNA levels in germ-free (GF) mice versus conventionally raised mice (CONV-R) (n=5). (D) Jejunum CB1 mRNA levels in the same groups of mice described in panels A, B and C. (E) Colon CB1 mRNA levels in mice fed a normal chow diet (CT) or a high-fat diet (HFD) enriched with or without prebiotics (HFD-Pre) for 14 weeks (n=7–8). (F) Jejunum CB1 mRNA levels in CT, HFD and HFD-Pre mice (n=7–8). (G) Colon CB1 mRNA levels in wild-type or Myd88−/− mice fed an HFD for 8 weeks (n=5). *P<0.05 as determined by a two-tailed Student's t-test. Data with different superscript letters were significantly different according to post hoc ANOVA one-way statistical analysis.
Figure 2
Figure 2
The eCB system controls gut permeability through a CB1 receptor-dependent mechanism. (A) AEA and 2-AG levels (per cent of control values), and FAAH and MGL mRNA levels in the colons of ob/ob mice fed a normal chow diet (Ob-CT) or treated with prebiotics (Ob-Pre) for 5 weeks (n=10). (B) Plasma LPS levels in ob/ob mice fed a normal chow diet (Ob-CT) or treated with prebiotics (Ob-Pre) for 5 weeks (n=10). (C) Plasma LPS levels in obese ob/ob mice treated with vehicle (Ob-CT), CB1 receptor antagonist or SR141716A (Ob-SR) (10 mg/kg//day) or pair fed (Ob-PF) for 12 days (n=6). (D) Relative score of tight junction (TJ) changes measured by immunohistological analysis of ZO-1 and occludin in the same mice as in panel C (n=6). (E) Canonical plot (biplot) showing the data and multivariate means in two dimensions that best separate the groups when one takes into account gut permeability markers. (F) Plasma LPS levels and (G) plasma levels of dextran-4000-FITC (FITC) in lean wild-type mice chronically infused with vehicle (CT) or the cannabinoid receptor agonist HU-210 (HU) (100 μg/kg/day) through mini-pumps implanted subcutaneously for 4 weeks (n=7). *P<0.05 as determined by a two-tailed Student's t-test. Data with different superscript letters were significantly different according to post hoc ANOVA one-way statistical analysis.
Figure 3
Figure 3
CB1 receptor antagonist treatment changes the distribution of tight junction proteins. Representative immunofluorescence staining for occludin and ZO-1 in obese ob/ob mice treated with vehicle (Ob-CT), CB1 receptor antagonist (SR141716A) (Ob-SR) (10 mg/kg/day) or pair fed (Ob-PF) for 12 days (n=6).
Figure 4
Figure 4
The eCB system controls gut permeability through a CB1 receptor-dependent mechanism in vitro. The impact of the CB1 and CB2 receptors, and LPS on gut permeability was investigated in an in vitro colonic epithelial monolayer cell model (Caco-2) by measuring tight junction protein markers (A) Occludin and (B) ZO-1 mRNA expression levels in colonic cells treated with vehicle (DMSO) or LPS (200 μg/ml) or in combination with the cannabinoid receptor agonist HU-210 (HU) (1 μM), the CB1 receptor antagonist SR141716A (SR1) (1 μM) or the CB2 receptor antagonist SR144528 (SR2) (1 μM). The data represent the mean of three to four different experiments performed in triplicate. Data with different superscript letters were significantly different according to post hoc ANOVA one-way statistical analysis.
Figure 5
Figure 5
Obese mice are characterised by higher eCB tone in subcutaneous adipose tissues. (A) NAPE-PLD (N-acylphosphatidylethanolamine-phospholipase D) mRNA, (B) CB1 mRNA, (C) FAAH mRNA and (D) AEA levels (per cent of lean values) in the subcutaneous adipose tissue of lean littermates (Lean-Ob) and obese ob/ob (Ob-Ob) mice (n=6). *P<0.05 as determined by a two-tailed Student's t-test.
Figure 6
Figure 6
Changes in gut microbiota decrease adiposity and CB1 mRNA expression, and regulate adipogenesis markers. (A) Adiposity index and (B) CB1 mRNA expression levels in the adipose tissue of ob/ob mice fed a normal chow diet (Ob-CT) or treated with prebiotics (Ob-Pre) for 5 weeks (n=10). (C) White adipose tissue AEA (per cent of control values) and FAAH mRNA levels were measured in the same group of mice (n=10). (D) Adipocyte differentiation (PPAR-γ, aP2 and C/EBP-α) and (E) lipogenesis (SREBP-1c, ACC and FAS) mRNA expression levels in the adipose tissue of the same group of mice (n=10). (F) Adipocyte differentiation (PPAR-γ, aP2 and C/EBP-α) mRNA expression levels and (G) lipogenesis (SREBP-1c, ACC and FAS) mRNA expression levels in adipose tissue from obese ob/ob mice treated with vehicle (Ob-CT) or CB1 receptor antagonist (SR141716A) (Ob-SR) (10 mg/kg/day) for 12 days (n=6). *P<0.05 as determined by a two-tailed Student's t-test.
Figure 7
Figure 7
Stimulation of the eCB system leads to adipogenesis in vivo in lean mice. (A) Adiposity index and (B) adipocyte differentiation (PPAR-γ, aP2 and C/EBP-α) (C) lipogenesis (SREBP-1c, ACC and FAS) and CB1 mRNA expression levels measured in lean wild-type mice chronically infused with vehicle (CT) or cannabinoid receptor agonist HU-210 (HU) (100 μg/kg/day) through mini-pumps implanted subcutaneously for 4 weeks (n=7). (D) Mean adipocyte surface area (μm2), adipocyte size (μm2) distribution and a representative haematoxylin and eosin-stained adipose tissue section (n=7) from the same group of mice. *P<0.05 as determined by a two-tailed Student's t-test. (E) Heat map profile and dendrogram analysis constructed on the basis of adipocyte differentiation mRNA levels, lipogenesis mRNA levels and adipocyte size markers.
Figure 8
Figure 8
The eCB system directly regulates adipogenesis in cultures of adipose tissue explants, and LPS acts as a master switch both in vitro and in vivo. (A) mRNA expression levels of the adipocyte differentiation markers PPAR-γ, aP2 and C/EBP-α; (B) mRNA expression levels of the lipogenesis markers SREBP-1c and FAS and (C) mRNA expression levels of CB1 in cultured adipose tissue explants exposed to vehicle (CT), LPS or cannabinoid receptor agonist HU-210 (HU) (100 nM) alone or in combination with LPS (100 ng/ml) for 24 h. (D) mRNA levels of the adipocyte differentiation markers PPAR-γ, aP2 and C/EBP-α and the lipogenesis markers SREBP-1c, ACC and FAS in lean wild-type mice chronically infused with cannabinoid receptor agonist (HU) (100 μg/kg/day) with or without the addition of LPS (HU-LPS) (300 μg/kg/day) through mini-pumps implanted subcutaneously for 4 weeks (n=7). (E) mRNA levels of an adipocyte differentiation marker (aP2), (F) a lipogenesis marker (FAS) and (G) CB1 measured in cultured adipose tissue explants exposed to a PPAR-γ agonist (troglitazone, TZD) (10 μM) alone or in combination with LPS for 24 h. The data are the mean of four to five different determinations from 25 pooled mouse adipose depots. *Indicates P<0.05 for the drug effect; # indicates P<0.05 for the effects of LPS; and +indicates P<0.07 by a two-tailed, Student's t-test.
Figure 9
Figure 9
eCB system-LPS crosstalk participates in the regulation of adipogenesis by gut microbiota. Activation of the eCB system in the intestine (e.g. through gut microbiota) increases gut permeability, which enhances plasma LPS levels. This exacerbates gut barrier disruption and peripheral eCB system tone in both the intestine and adipose tissues. Increased fat mass results in enhanced eCB system tone. LPS inhibits both PPAR-induced and cannabinoid ligand-induced adipogenesis. Overall, the impairment of these regulatory loops within colon and adipose tissues found in obesity perpetuates the initial disequilibrium, leading to a vicious cycle. This cycle maintains the increased gut permeability, eCB system tone, adipogenesis and fat mass development that characterise obesity.

References

    1. Backhed F, Ding H, Wang T, Hooper LV, Koh GY, Nagy A, Semenkovich CF, Gordon JI (2004) The gut microbiota as an environmental factor that regulates fat storage. Proc Natl Acad Sci USA 101: 15718–15723 - PMC - PubMed
    1. Backhed F, Manchester JK, Semenkovich CF, Gordon JI (2007) Mechanisms underlying the resistance to diet-induced obesity in germ-free mice. Proc Natl Acad Sci USA 104: 979–984 - PMC - PubMed
    1. Bennetzen MF, Nielsen TS, Paulsen SK, Bendix J, Fisker S, Jessen N, Lund S, Richelsen B, Pedersen SB (2010) Reduced cannabinoid receptor 1 protein in subcutaneous adipose tissue of obese. Eur J Clin Invest 40: 121–126 - PubMed
    1. Bellocchio L, Cervino C, Vicennati V, Pasquali R, Pagotto U (2008) Cannabinoid type 1 receptor: another arrow in the adipocytes' bow. J Neuroendocrinol 20(Suppl 1): 130–138 - PubMed
    1. Bluher M, Engeli S, Kloting N, Berndt J, Fasshauer M, Batkai S, Pacher P, Schon MR, Jordan J, Stumvoll M (2006) Dysregulation of the peripheral and adipose tissue endocannabinoid system in human abdominal obesity. Diabetes 55: 3053–3060 - PMC - PubMed

Publication types

MeSH terms