

Microdevices integrating affinity columns and capillary electrophoresis for multibiomarker analysis in human serum
- PMID: 20664867
- PMCID: PMC2998056
- DOI: 10.1039/c005288d
Microdevices integrating affinity columns and capillary electrophoresis for multibiomarker analysis in human serum
Abstract
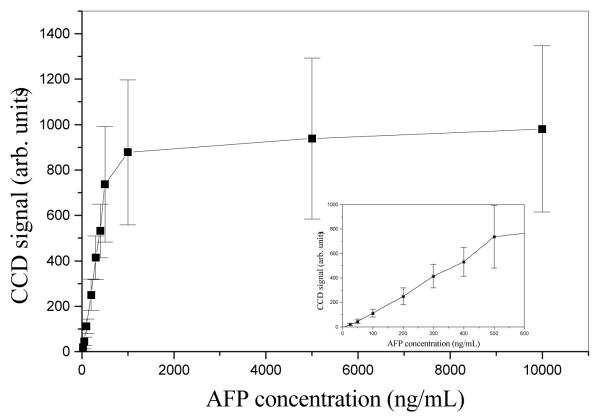
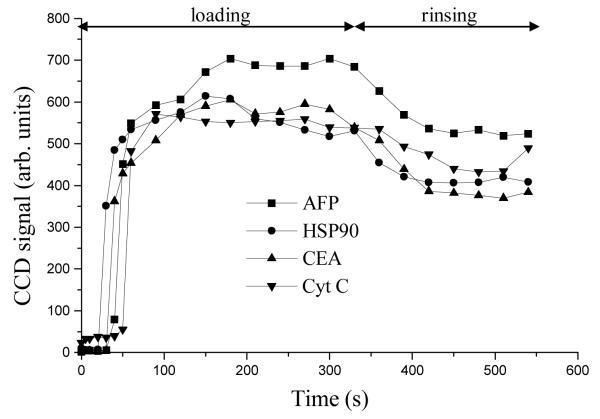
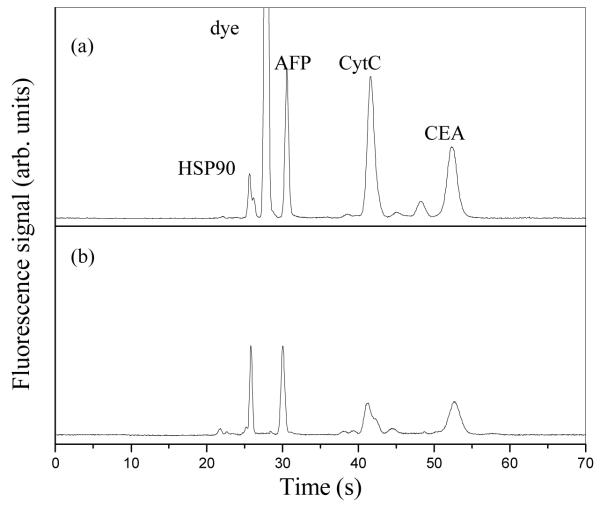
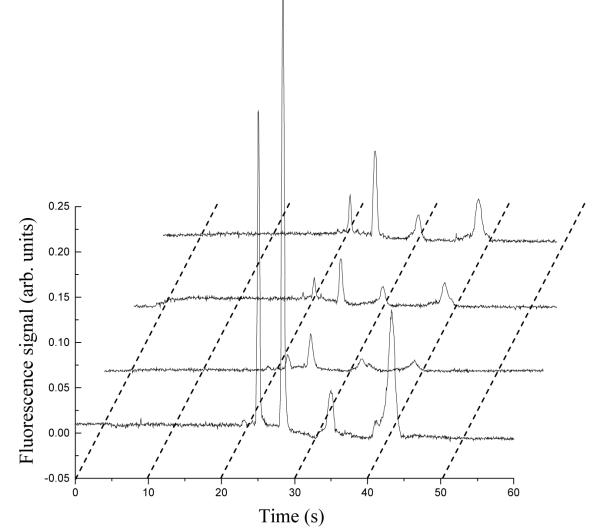
Biomarkers in human body fluids have great potential for use in screening for diseases such as cancer and diabetes, diagnosis, determining the effectiveness of treatments, and detecting recurrence. Present 96-well immunoassay technology effectively analyzes large numbers of samples; however, this approach is more expensive and less time effective on single or a few samples. In contrast, microfluidic systems are well suited for assaying small numbers of specimens in a point-of-care setting, provided suitable procedures are developed to work within peak capacity constraints when analyzing complex mixtures like human blood serum. Here, we developed integrated microdevices with an affinity column and capillary electrophoresis channels to isolate and quantitate a panel of proteins in complex matrices. To form an affinity column, a thin film of a reactive polymer was photopolymerized in a microchannel, and four antibodies were covalently immobilized to it. The retained protein amounts were consistent from chip to chip, demonstrating reproducibility. Furthermore, the signals from four fluorescently labeled proteins captured on-column were in the same range after rinsing, indicating the column has little bias toward any of the four antibodies or their antigens. These affinity columns have been integrated with capillary electrophoresis separation, enabling us to simultaneously quantify four protein biomarkers in human blood serum in the low ng mL(-1) range using either a calibration curve or standard addition. Our systems provide a fast, integrated and automated platform for multiple biomarker quantitation in complex media such as human blood serum.
Figures


References
-
- American Cancer Society Cancer Facts and Figures. [Access date: 3/23/2010]. 2009. http://www.cancer.org/downloads/STT/500809web.pdf.
-
- Nass SJ, Moses HL, editors. Cancer biomarkers: the promises and challenges of improving detection and treatment. National Academies Press; Washington, D.C.: 2007.
-
- Verma M, Seminara D, Arena FJ, John C, Iwamoto K, Hartmuller V. Mol. Diagn. Ther. 2006;10:1–15. - PubMed
-
- Makarov DV, Loeb S, Getzenberg RH, Partin AW. Annu. Rev. Med. 2009;60:139–151. - PubMed
Publication types
MeSH terms
Substances
Grants and funding
LinkOut - more resources
Full Text Sources