

Cytokeratin 5 positive cells represent a steroid receptor negative and therapy resistant subpopulation in luminal breast cancers
- PMID: 20665103
- PMCID: PMC3851293
- DOI: 10.1007/s10549-010-1078-6
Cytokeratin 5 positive cells represent a steroid receptor negative and therapy resistant subpopulation in luminal breast cancers
Abstract
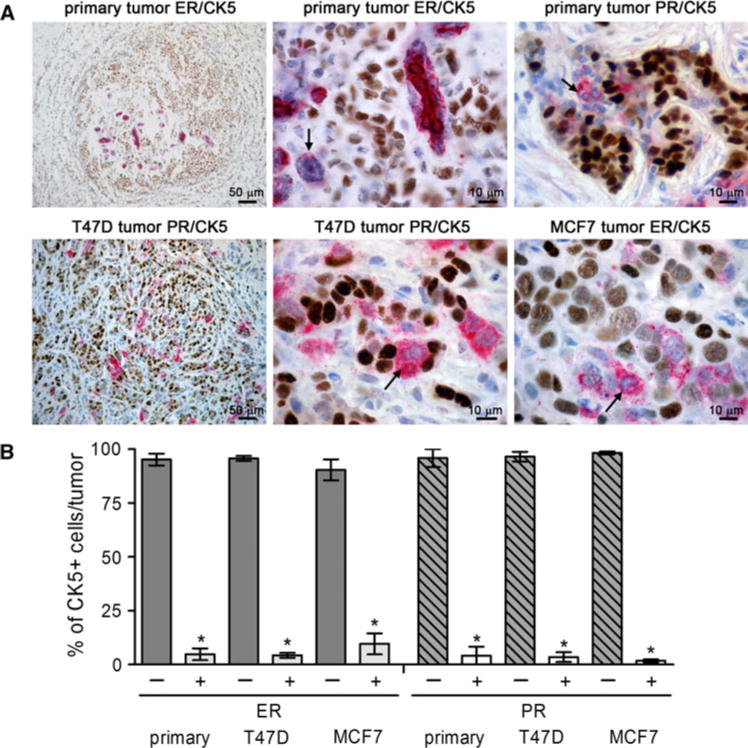
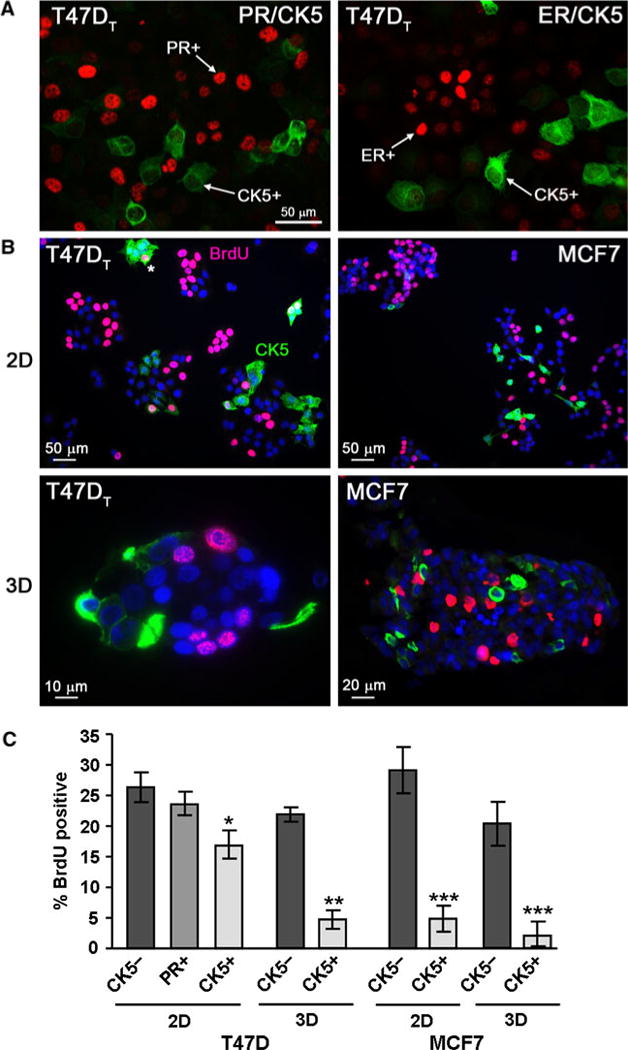
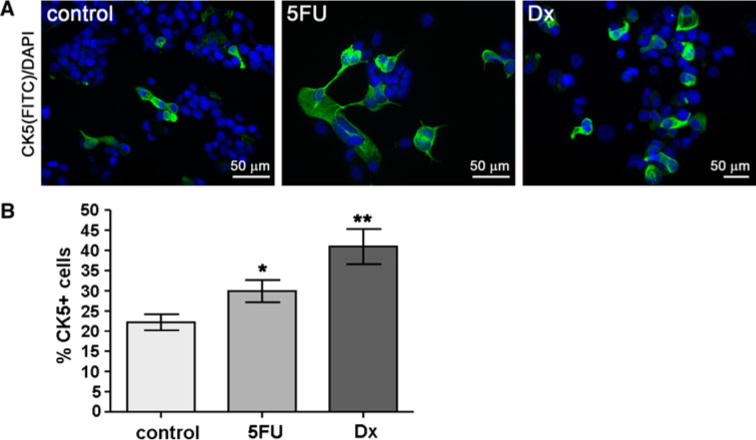
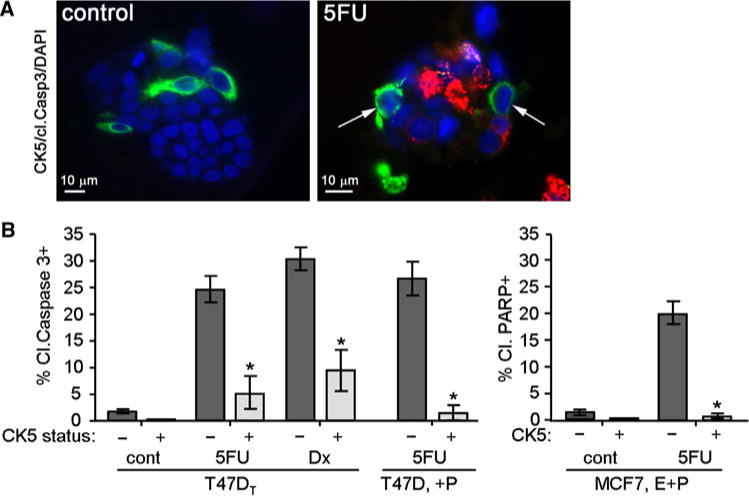
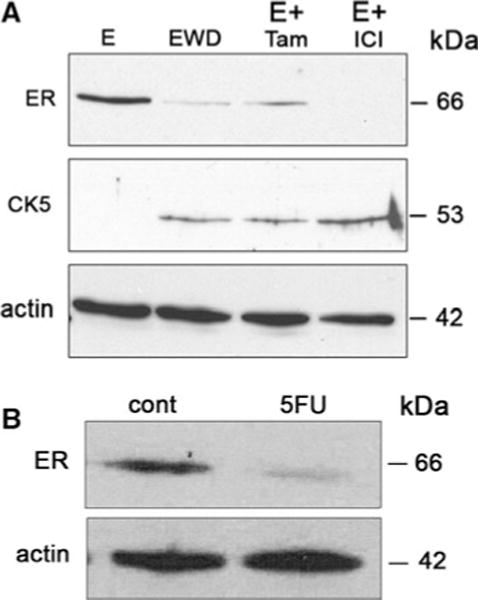
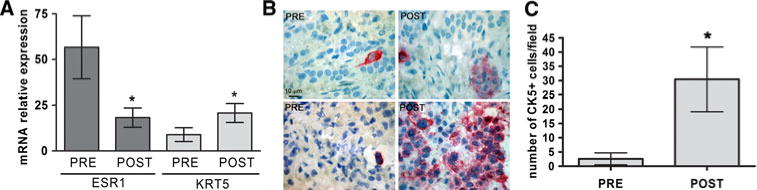
A majority of breast cancers are estrogen receptor (ER) positive and have a luminal epithelial phenotype. However, these ER⁺ tumors often contain heterogeneous subpopulations of ER⁻ tumor cells. We previously identified a population of cytokeratin 5 (CK5) positive cells within ER⁺ and progesterone receptor positive (PR⁺) tumors that is both ER⁻PR⁻ and CD44⁺, a marker of breast tumor-initiating cells (TICs). These CK5⁺ cells have properties of TICs in luminal tumor xenografts, and we speculated that they are more resistant to chemo- and anti-ER-targeted therapies than their ER⁺ neighbors. To test this, we used ER⁺PR⁺ T47D and MCF7 breast cancer cells. CK5⁺ cells had lower proliferative indices than CK5⁻ cells, were less sensitive to 5-fluorouracil and docetaxel, and cultures became enriched for CK5⁺ cells after treatments. CK5⁺ cells were less prone to drug-induced apoptosis than CK5⁻ cells. In cells treated with 17β-estradiol (E) plus anti-estrogens tamoxifen or fulvestrant, ER protein levels decreased, and CK5 protein levels increased, compared to controls treated with E alone. In ER⁺ tumors from patients treated with neoadjuvant endocrine therapies ER gene expression decreased, and CK5 gene expression increased in post compared to pre-treatment tumors. The number of CK5⁺ cells in tumors also increased in post- compared to pre-treatment tumors. We conclude that an ER⁻PR⁻CK5⁺ subpopulation found in many luminal tumors is resistant to standard endocrine and chemotherapies, relative to the majority ER⁺PR⁺CK5⁻ cells. Compounds that effectively target these cells are needed to improve outcome in luminal breast cancers.
Conflict of interest statement
Figures
Similar articles
-
Modeling luminal breast cancer heterogeneity: combination therapy to suppress a hormone receptor-negative, cytokeratin 5-positive subpopulation in luminal disease.Breast Cancer Res. 2014 Aug 13;16(4):418. doi: 10.1186/s13058-014-0418-6. Breast Cancer Res. 2014. PMID: 25116921 Free PMC article.
-
Steroid induction of therapy-resistant cytokeratin-5-positive cells in estrogen receptor-positive breast cancer through a BCL6-dependent mechanism.Oncogene. 2016 Mar 17;35(11):1373-85. doi: 10.1038/onc.2015.193. Epub 2015 Jun 22. Oncogene. 2016. PMID: 26096934 Free PMC article.
-
Luminal breast cancer metastases and tumor arousal from dormancy are promoted by direct actions of estradiol and progesterone on the malignant cells.Breast Cancer Res. 2014 Dec 5;16(6):489. doi: 10.1186/s13058-014-0489-4. Breast Cancer Res. 2014. PMID: 25475897 Free PMC article.
-
Biology of progesterone receptor loss in breast cancer and its implications for endocrine therapy.J Clin Oncol. 2005 Oct 20;23(30):7721-35. doi: 10.1200/JCO.2005.09.004. J Clin Oncol. 2005. PMID: 16234531 Review.
-
Steroid Hormone Receptor Positive Breast Cancer Patient-Derived Xenografts.Horm Cancer. 2017 Feb;8(1):4-15. doi: 10.1007/s12672-016-0275-0. Epub 2016 Oct 28. Horm Cancer. 2017. PMID: 27796944 Free PMC article. Review.
Cited by
-
An immunohistochemical method to study breast cancer cell subpopulations and their growth regulation by hormones in three-dimensional cultures.Front Endocrinol (Lausanne). 2011 Jun 21;2:15. doi: 10.3389/fendo.2011.00015. eCollection 2011. Front Endocrinol (Lausanne). 2011. PMID: 22649363 Free PMC article.
-
The network of pluripotency, epithelial-mesenchymal transition, and prognosis of breast cancer.Breast Cancer (Dove Med Press). 2015 Sep 7;7:303-19. doi: 10.2147/BCTT.S71163. eCollection 2015. Breast Cancer (Dove Med Press). 2015. PMID: 26379447 Free PMC article. Review.
-
Epithelial-Mesenchymal Transition (EMT) and Regulation of EMT Factors by Steroid Nuclear Receptors in Breast Cancer: A Review and in Silico Investigation.J Clin Med. 2016 Jan 19;5(1):11. doi: 10.3390/jcm5010011. J Clin Med. 2016. PMID: 26797644 Free PMC article. Review.
-
Macrophages Promote Subtype Conversion and Endocrine Resistance in Breast Cancer.Cancers (Basel). 2024 Feb 5;16(3):678. doi: 10.3390/cancers16030678. Cancers (Basel). 2024. PMID: 38339428 Free PMC article.
-
Cytokeratin 5-Positive Cells Represent a Therapy Resistant subpopulation in Epithelial Ovarian Cancer.Int J Gynecol Cancer. 2015 Nov;25(9):1565-73. doi: 10.1097/IGC.0000000000000553. Int J Gynecol Cancer. 2015. PMID: 26495758 Free PMC article.
References
-
- Osborne CK, Schiff R. Estrogen-receptor biology: continuing progress and therapeutic implications. J Clin Oncol. 2005;23:1616–1622. - PubMed
Publication types
MeSH terms
Substances
Grants and funding
LinkOut - more resources
Full Text Sources
Other Literature Sources
Medical
Research Materials
Miscellaneous
