. 2010 Aug;64(2):418-29.
doi: 10.1002/mrm.22407.

A simple method for rectified noise floor suppression: Phase-corrected real data reconstruction with application to diffusion-weighted imaging

Affiliations

A simple method for rectified noise floor suppression: Phase-corrected real data reconstruction with application to diffusion-weighted imaging

Douglas E Prah et al. Magn Reson Med. 2010 Aug.

Abstract

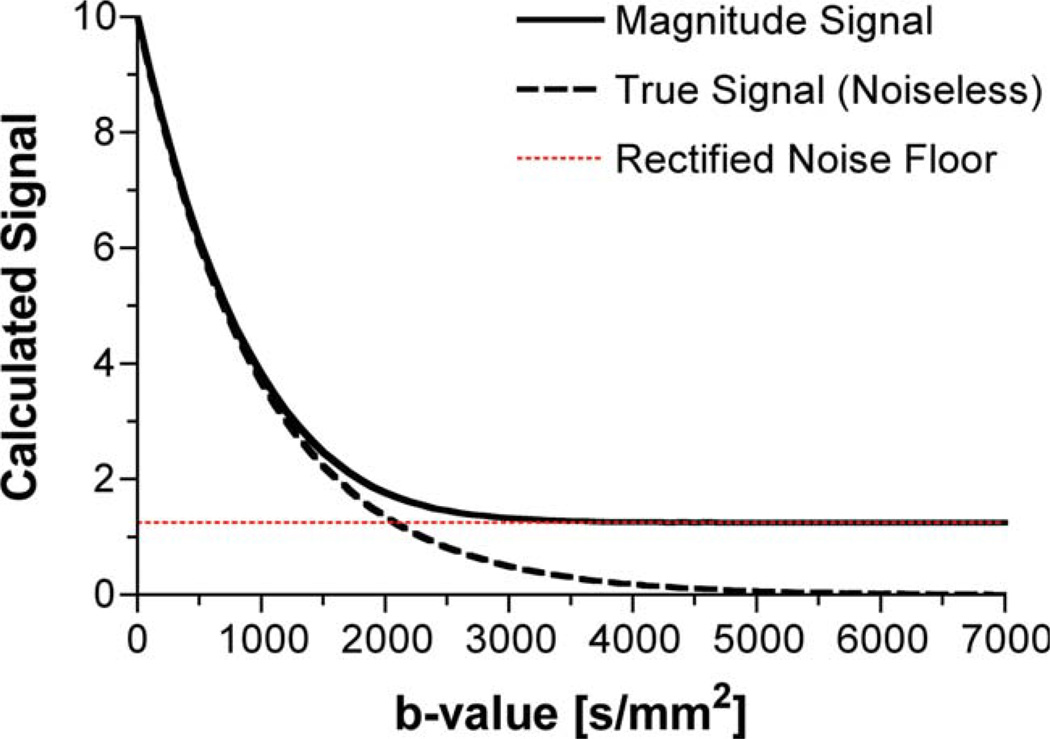
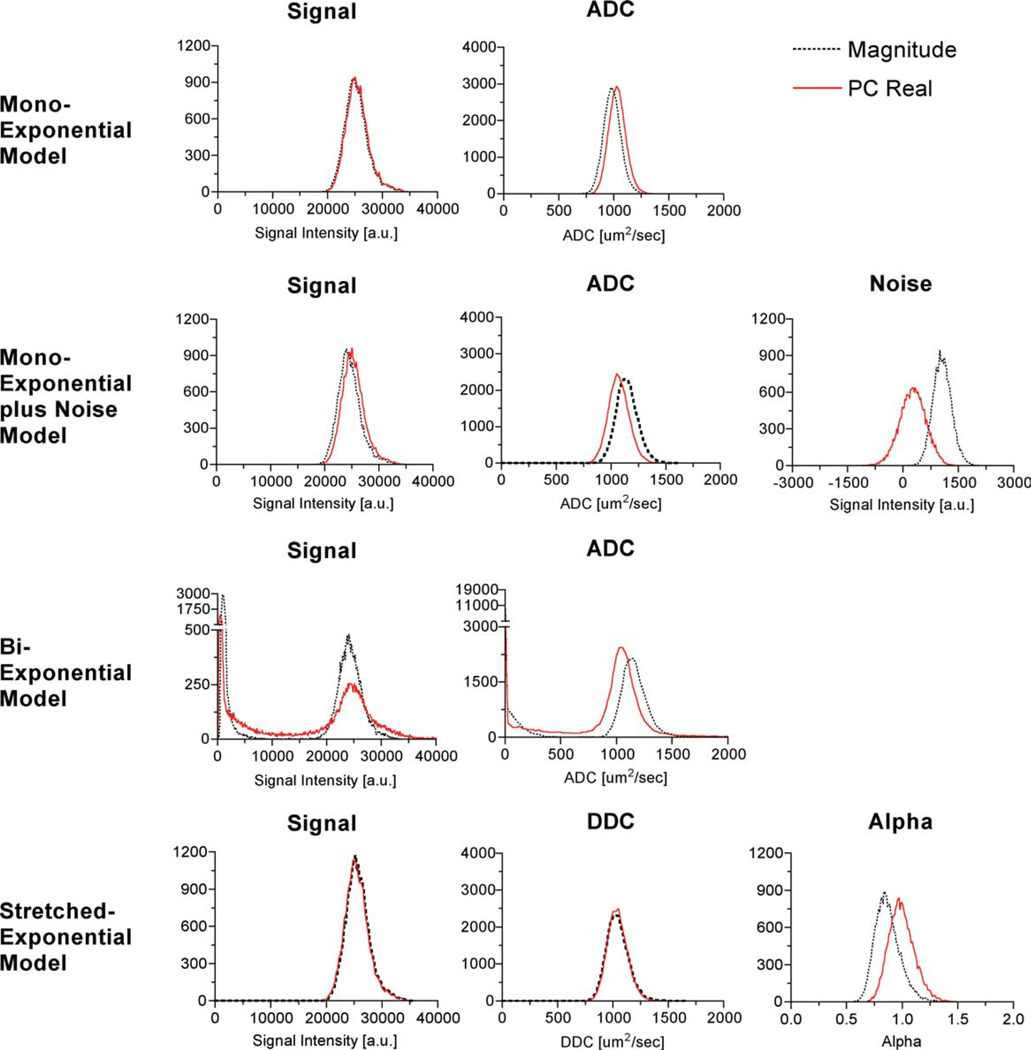
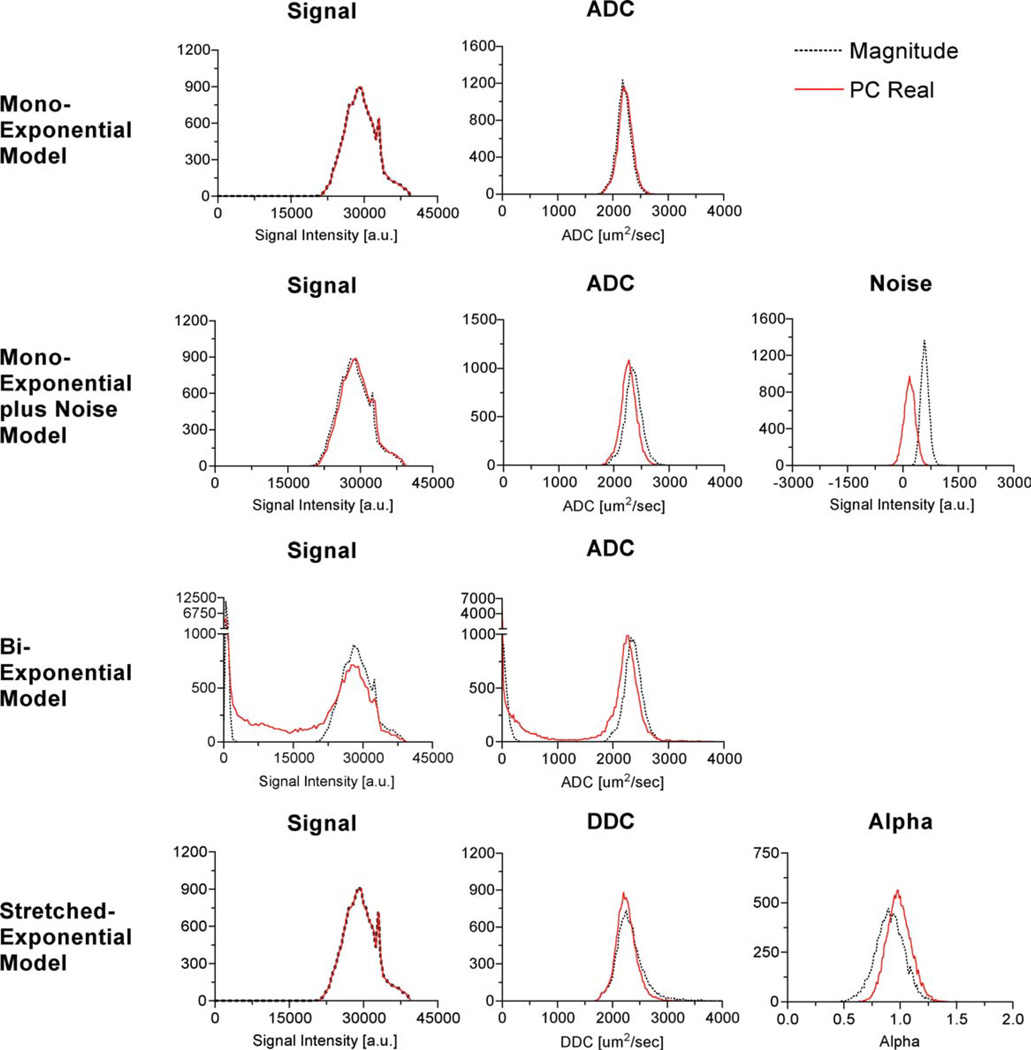
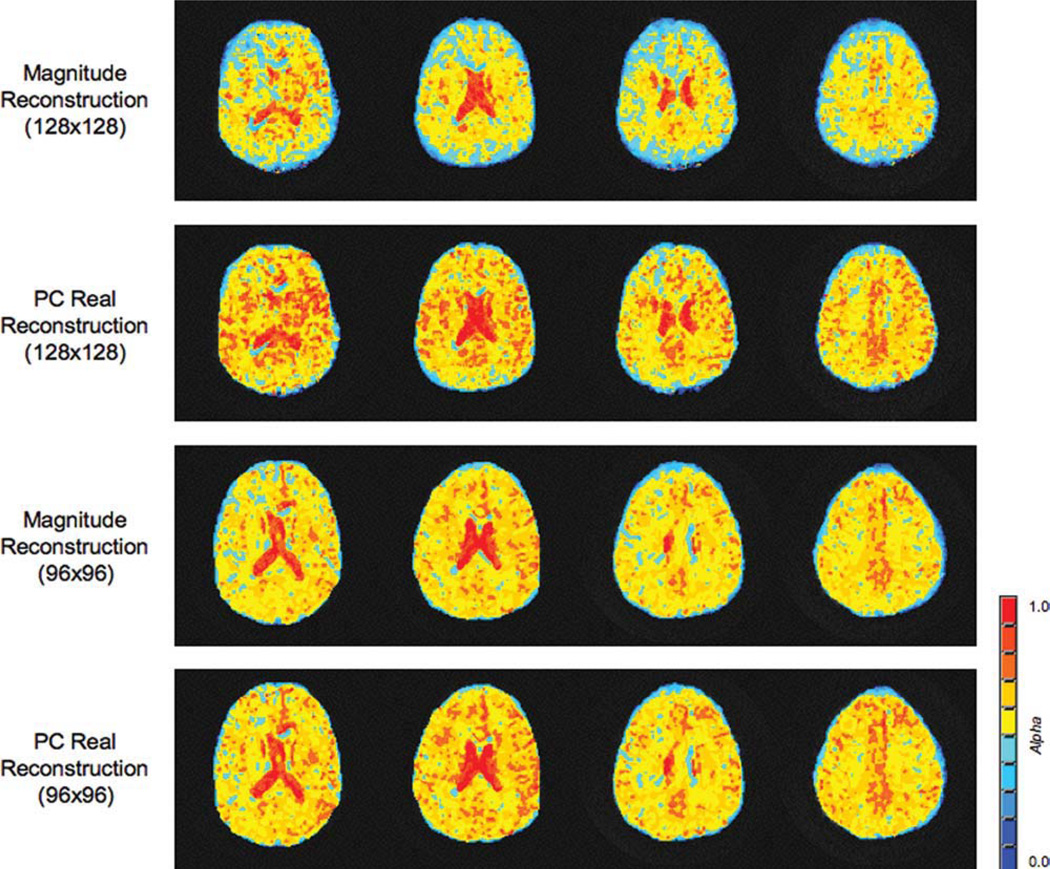
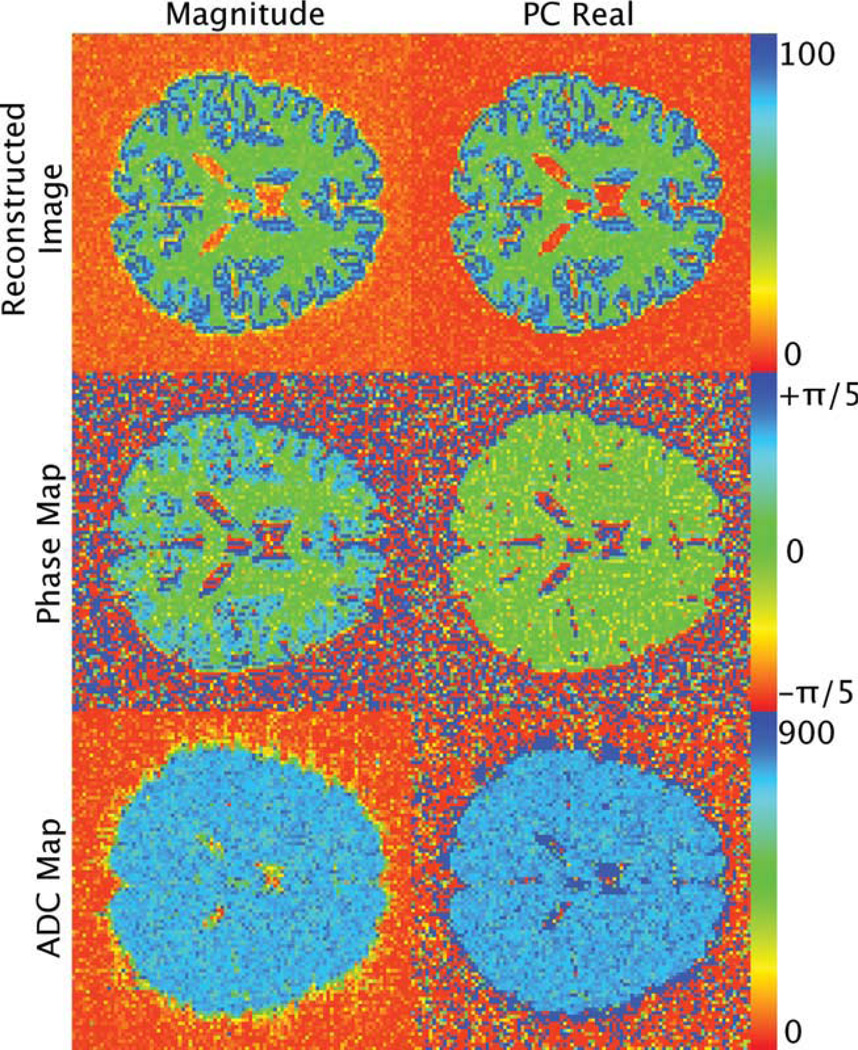
Diffusion-weighted MRI is an intrinsically low signal-to-noise ratio application due to the application of diffusion-weighting gradients and the consequent longer echo times. The signal-to-noise ratio worsens with increasing image resolution and diffusion imaging methods that use multiple and higher b-values. At low signal-to-noise ratios, standard magnitude reconstructed diffusion-weighted images are confounded by the existence of a rectified noise floor, producing poor estimates of diffusion metrics. Herein, we present a simple method of rectified noise floor suppression that involves phase correction of the real data. This approach was evaluated for diffusion-weighted imaging data, obtained from ethanol and water phantoms and the brain of a healthy volunteer. The parameter fits from monoexponential, biexponential, and stretched-exponential diffusion models were computed using phase-corrected real data and magnitude data. The results demonstrate that this newly developed simple approach of using phase-corrected real images acts to reduce or even suppress the confounding effects of a rectified noise floor, thereby producing more accurate estimates of diffusion parameters.


Figures

FIG 1
FIG 1
The effect of the rectified noise floor on the diffusion weighted signal as a function of the signal-to-noise ratio. The data were generated in Matlab by adding normally distributed noise to both the real and imaginary signal having an original phase angle of zero. The “true signal” estimate of the diffusion attenuation curve was generated using an ADC of 1000 µm2/sec. The rectified noise floor is calculated by taking the root mean sum of squares of the noise added to the real and imaginary channels. Both the magnitude signal and the rectified noise floor represent the mean value of 105 iterations. [Color figure can be viewed in the online issue, which is available at www.interscience.wiley.com.]
FIG 2
FIG 2
The effects of the phase correction’s kernel size on the mean noise of the phase-corrected real and imaginary images. The size of the filtering kernel determines the degree of noise offset seen in the PC real imaged. As the size of the filtering kernel increases, the mean of the PC real noise approached the original mean of zero. The standard deviation of the PC imaginary is reduced at smaller kernel sizes but maintains a zero mean for all kernel sizes. [Color figure can be viewed in the online issue, which is available at www.interscience.wiley.com.]
FIG 3
FIG 3
Histograms taken from a single slice of the noise-only magnitude, real, and imaginary images. The complex data were obtained using a standard line scan sequence using a 0° flip angle of a cylindrical phantom. Each histogram represents 16,384 voxels. Both the real and the imaginary image data passed the Kolmogorov-Smirnov test for normality (P < 0.05). Note that the magnitude image data, unlike the original real and imaginary image data, have a different noise distribution, the Raleigh distribution.
FIG 4
FIG 4
Histograms of the magnitude, phase-corrected real, and phase-corrected imaginary images as a function of b-value (0–3000 sec/mm2 from top to bottom), taken from a single 2 mm slice of an ethanol phantom.
FIG 5
FIG 5
Histograms of the signal and diffusion parameter fits of the ethanol phantom at room temperature for the monoexponential, monoexponential plus noise, biexponential, and the stretched-exponential models. Each model was voxelwise fit to the data. The published diffusion coefficient of room temperature ethanol is 1100 ± 200 µm2/msec (31). [Color figure can be viewed in the online issue, which is available at www.interscience.wiley.com.]
FIG 6
FIG 6
Histograms of the signal and diffusion parameter fits of the water phantom at room temperature for the monoexponential, monoexponential plus noise, biexponential, and the stretched-exponential models. Each model was voxelwise fit to the data. The published diffusion coefficient of room temperature water is 2200 ± 200 µm2/msec (31). [Color figure can be viewed in the online issue, which is available at www.interscience.wiley.com.]
FIG 7
FIG 7
α Parameter maps obtained from the stretched-exponential model of a human subject. All four sets of images were obtained using the same field of view and slice thickness. Two different matrix sizes were collected to demonstrate the effect that the SNR can have on the parameter fits of the stretched-exponential model. Note the lower overall values of α obtained with the standard reconstruction compared to the PC real reconstruction technique. As the matrix size decreases for the same field of view, i.e., the voxel volume increases, an increase in the corresponding SNR is observed. Consequentially, the standard magnitude reconstruction underestimates a if the SNR is reduced. However, for a sufficiently high SNR, both reconstruction techniques yield similar results. [Color figure can be viewed in the online issue, which is available at www.interscience.wiley.com.]
FIG 8
FIG 8
Reconstructed images, phase maps, and ADC maps for the magnitude and PC real reconstruction techniques obtained from the border effect simulation. The reconstructed images are of the b = 2000 msec/mm2 image and consequentially have an SNR range of 12 to 22. The corresponding calculated ADC maps are also presented. The boundary effects are negligible in the phase maps and ADC map of the PC real data. The reconstructed images were normalized to the maximum value. The phase maps are displayed in units of radians. The ADC maps are displayed in units of micrometers squared per millisecond.

Similar articles

Cited by

References

    1. Chenevert TL, Stegman LD, Taylor JM, Robertson PL, Greenberg HS, Rehemtulla A, Ross BD. Diffusion magnetic resonance imaging: an early surrogate marker of therapeutic efficacy in brain tumors. J Natl Cancer Inst. 2000;92:2029–2036. - PubMed
    1. Moseley ME, Kucharczyk J, Mintorovitch J, Cohen Y, Kurhanewicz J, Derugin N, Asgari H, Norman D. Diffusion-weighted MR imaging of acute stroke: correlation with T2-weighted and magnetic susceptibility-enhanced MR imaging in cats. AJNR Am J Neuroradiol. 1990;11:423–429. - PMC - PubMed
    1. Ross BD, Moffat BA, Lawrence TS, Mukherji SK, Gebarski SS, Quint DJ, Johnson TD, Junck L, Robertson PL, Muraszko KM, Dong Q, Meyer CR, Bland PH, McConville P, Geng H, Rehemtulla A, Chenevert TL. Evaluation of cancer therapy using diffusion magnetic resonance imaging. Mol Cancer Ther. 2003;2:581–587. - PubMed
    1. Mulkern RV, Barnes AS, Haker SJ, Hung YP, Rybicki FJ, Maier SE, Tempany CM. Biexponential characterization of prostate tissue water diffusion decay curves over an extended b-factor range. Magn Reson Imaging. 2006;24:563–568. - PMC - PubMed
    1. Theilmann RJ, Borders R, Trouard TP, Xia G, Outwater E, Ranger-Moore J, Gillies RJ, Stopeck A. Changes in water mobility measured by diffusion MRI predict response of metastatic breast cancer to chemotherapy. Neoplasia. 2004;6:831–837. - PMC - PubMed

MeSH terms