

EPR spectroscopy of nitrite complexes of methemoglobin
- PMID: 20666390
- PMCID: PMC4498954
- DOI: 10.1021/ic902085s
EPR spectroscopy of nitrite complexes of methemoglobin
Abstract
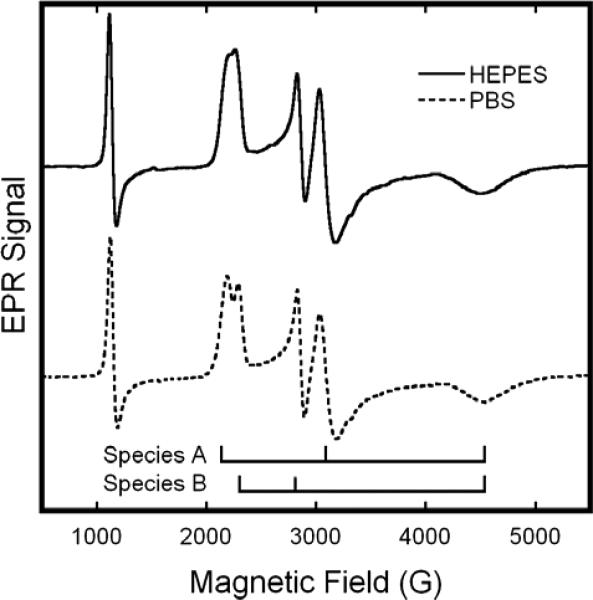
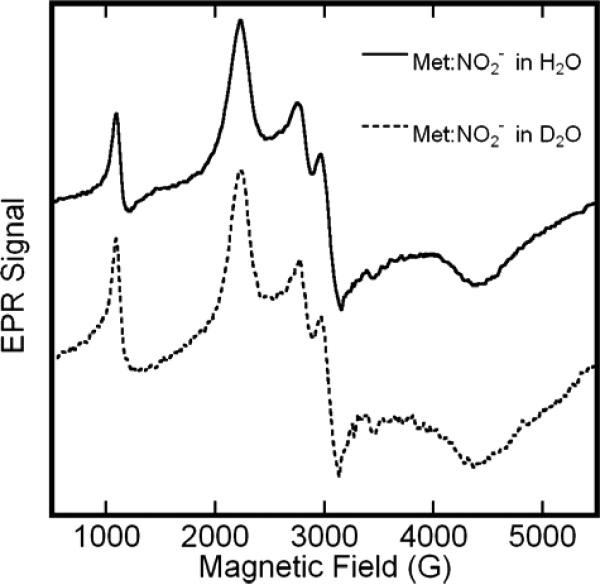
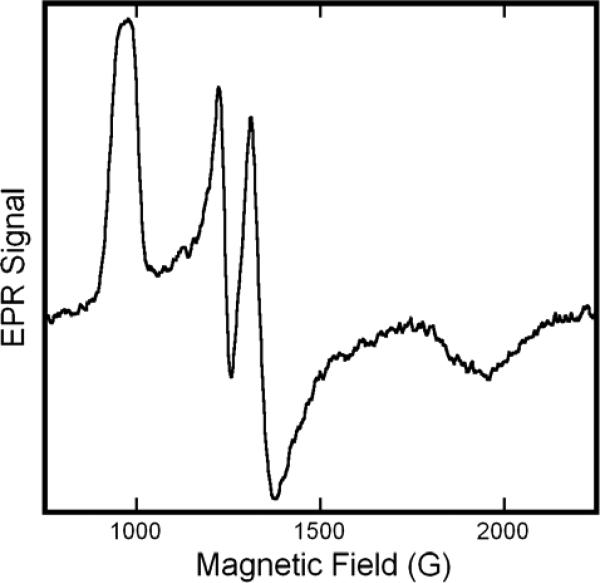
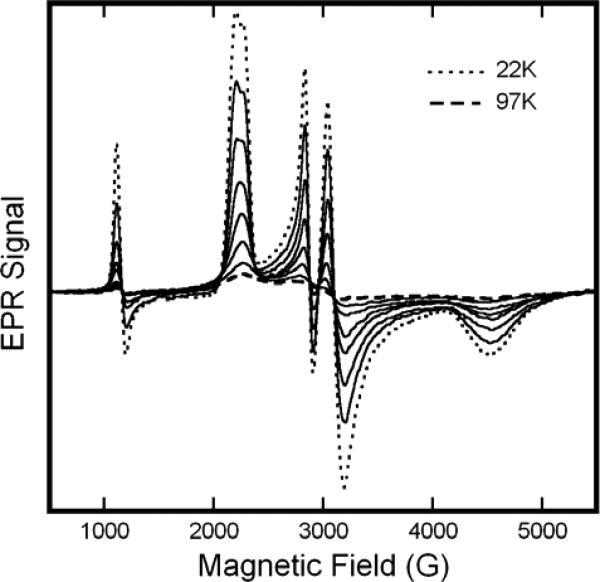
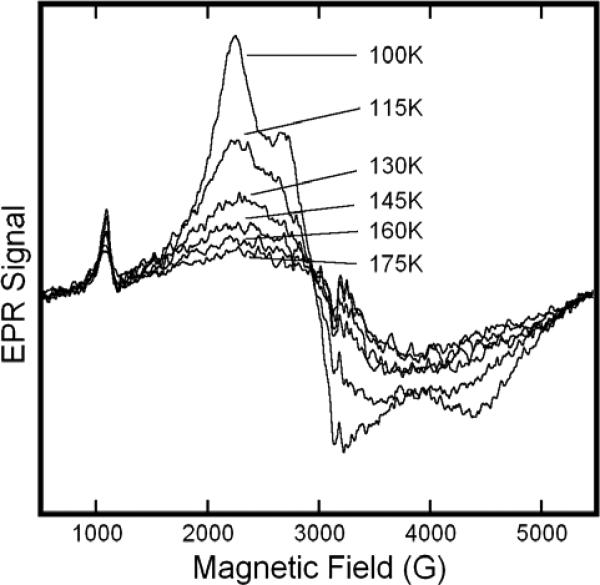
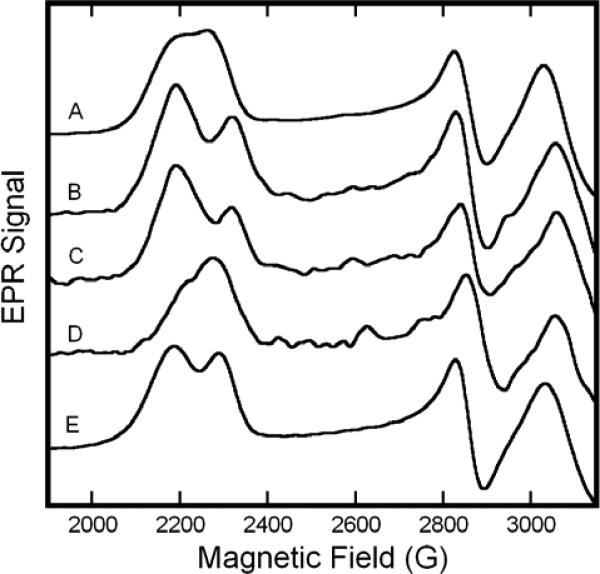
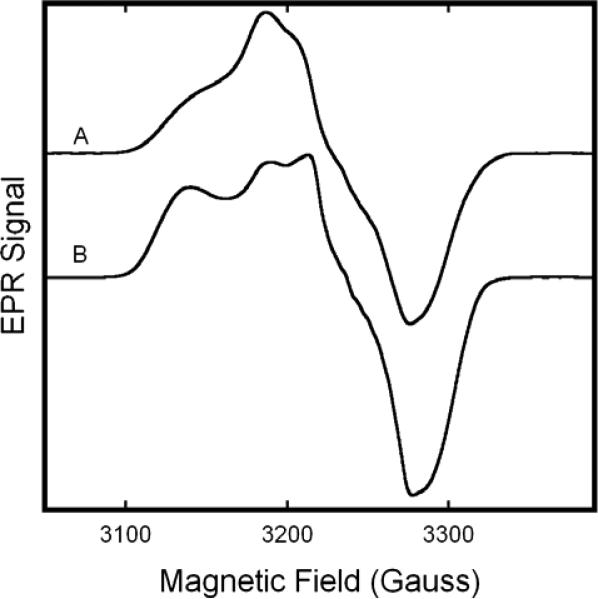
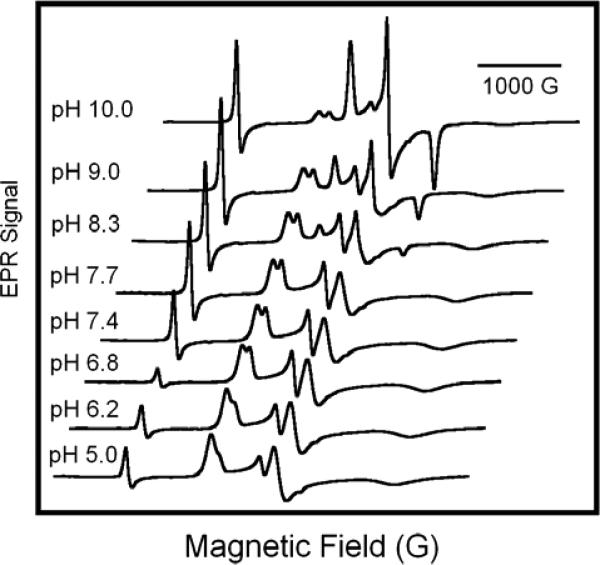
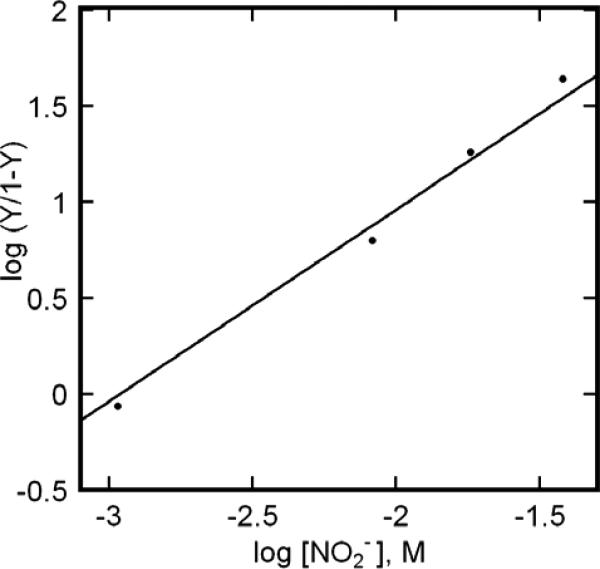
The chemical interplay of nitrogen oxides (NO's) with hemoglobin (Hb) has attracted considerable recent attention because of its potential significance in the mechanism of NO-related vasoactivity regulated by Hb. An important theme of this interplay-redox coupling in adducts of heme iron and NO's-has sparked renewed interest in fundamental studies of FeNO(x) coordination complexes. In this Article, we report combined UV-vis and comprehensive electron paramagnetic resonance (EPR) spectroscopic studies that address intriguing questions raised in recent studies of the structure and affinity of the nitrite ligand in complexes with Fe(III) in methemoglobin (metHb). EPR spectra of metHb/NO(2)(-) are found to exhibit a characteristic doubling in their sharper spectral features. Comparative EPR measurements at X- and S-band frequencies, and in D(2)O versus H(2)O, argue against the assignment of this splitting as hyperfine structure. Correlated changes in the EPR spectra with pH enable complete assignment of the spectrum as deriving from the overlap of two low-spin species with g values of 3.018, 2.122, 1.45 and 2.870, 2.304, 1.45 (values for samples at 20 K and pH 7.4 in phosphate-buffered saline). These g values are typical of g values found for other heme proteins with N-coordinated ligands in the binding pocket and are thus suggestive of N-nitro versus O-nitrito coordination. The positions and shapes of the spectral lines vary only slightly with temperature until motional averaging ensues at approximately 150 K. The pattern of motional averaging in the variable-temperature EPR spectra and EPR studies of Fe(III)NO(2)(-)/Fe(II)NO hybrids suggest that one of two species is present in both of the alpha and beta subunits, while the other is exclusive to the beta subunit. Our results also reconfirm that the affinity of nitrite for metHb is of millimolar magnitude, thereby making a direct role for nitrite in physiological hypoxic vasodilation difficult to justify.
Figures
Similar articles
-
Hemoglobin as a nitrite anhydrase: modeling methemoglobin-mediated N2O3 formation.Chemistry. 2011 May 27;17(23):6348-58. doi: 10.1002/chem.201003578. Epub 2011 May 17. Chemistry. 2011. PMID: 21590821 Free PMC article.
-
An electron paramagnetic resonance study of the affinity of nitrite for methemoglobin.Nitric Oxide. 2010 Feb 15;22(2):149-54. doi: 10.1016/j.niox.2009.10.009. Epub 2009 Nov 4. Nitric Oxide. 2010. PMID: 19895897 Free PMC article.
-
Distinguishing Nitro vs Nitrito Coordination in Cytochrome c' Using Vibrational Spectroscopy and Density Functional Theory.Inorg Chem. 2017 Nov 6;56(21):13205-13213. doi: 10.1021/acs.inorgchem.7b01945. Inorg Chem. 2017. PMID: 29053273 Free PMC article.
-
Formation of nitri- and nitrosylhemoglobin in systems modeling the Maillard reaction.Clin Chem Lab Med. 2014 Jan 1;52(1):161-8. doi: 10.1515/cclm-2012-0792. Clin Chem Lab Med. 2014. PMID: 23979125
-
The new chemical biology of nitrite reactions with hemoglobin: R-state catalysis, oxidative denitrosylation, and nitrite reductase/anhydrase.Acc Chem Res. 2009 Jan 20;42(1):157-67. doi: 10.1021/ar800089j. Acc Chem Res. 2009. PMID: 18783254 Review.
Cited by
-
Nitrite binding to globins: linkage isomerism, EPR silence and reductive chemistry.Nitric Oxide. 2014 Nov 15;42:32-9. doi: 10.1016/j.niox.2014.08.007. Epub 2014 Aug 27. Nitric Oxide. 2014. PMID: 25172022 Free PMC article.
-
Influence of the heme distal pocket on nitrite binding orientation and reactivity in Sperm Whale myoglobin.Biochem J. 2021 Feb 26;478(4):927-942. doi: 10.1042/BCJ20200596. Biochem J. 2021. PMID: 33543749 Free PMC article.
-
Scalable manufacturing platform for the production of methemoglobin as a non-oxygen carrying control material in studies of cell-free hemoglobin solutions.PLoS One. 2022 Feb 16;17(2):e0263782. doi: 10.1371/journal.pone.0263782. eCollection 2022. PLoS One. 2022. PMID: 35171971 Free PMC article.
-
A novel ultrasensitive surface plasmon resonance-based nanosensor for nitrite detection.RSC Adv. 2019 Jun 6;9(31):17698-17705. doi: 10.1039/c9ra02460c. eCollection 2019 Jun 4. RSC Adv. 2019. PMID: 35520579 Free PMC article.
References
Publication types
MeSH terms
Substances
Grants and funding
LinkOut - more resources
Full Text Sources
