

Heme-based sensing by the mammalian circadian protein CLOCK
- PMID: 20666392
- PMCID: PMC2920140
- DOI: 10.1021/ic902388q
Heme-based sensing by the mammalian circadian protein CLOCK
Abstract
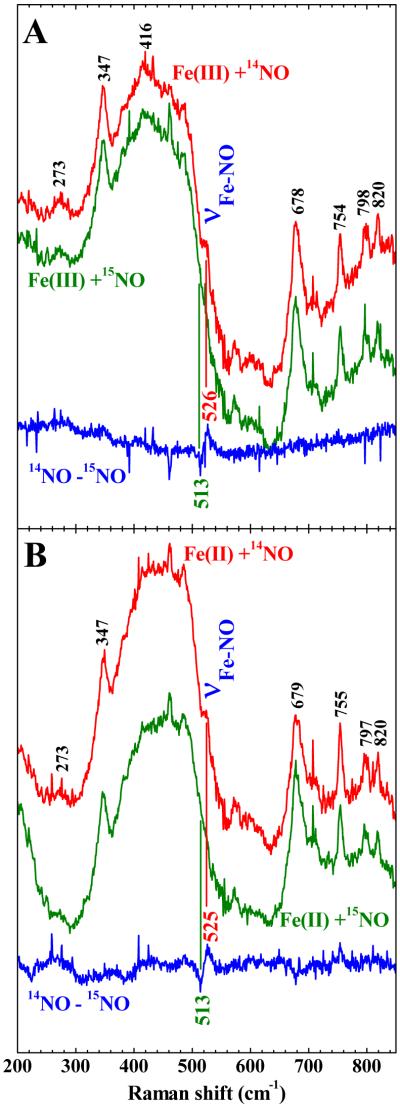
Heme is emerging as a key player in the synchrony of circadian-coupled transcriptional regulation. Current evidence suggests that levels of circadian-linked transcription are regulated in response to both the availability of intracellular heme and heme-based sensing of carbon monoxide (CO) and possibly nitric oxide (NO). The protein CLOCK is central to the regulation and maintenance of circadian rhythms in mammals. CLOCK comprises two PAS domains, each with a heme binding site. Our studies focus on the functionality of the murine CLOCK PAS-A domain (residues 103-265). We show that CLOCK PAS-A binds iron(III) protoporhyrin IX to form a complex with 1:1 stoichiometry. Optical absorbance and resonance Raman studies reveal that the heme of ferric CLOCK PAS-A is a six-coordinate, low-spin complex whose resonance Raman signature is insensitive to pH over the range of protein stability. Ferrous CLOCK PAS-A is a mixture of five-coordinate, high-spin and six-coordinate, low-spin complexes. Ferrous CLOCK PAS-A forms complexes with CO and NO. Ferric CLOCK PAS-A undergoes reductive nitrosylation in the presence of NO to generate a CLOCK PAS-A-NO, which is a five-coordinate {FeNO}(7) complex. Formation of the highly stable {FeNO}(7) heme complex from either ferrous or ferric heme makes possible the binding of NO at very low concentration, a characteristic of NO sensors. Comparison of the spectroscopic properties and CO-binding kinetics of CLOCK PAS-A with other CO sensor proteins reveals that CLOCK PAS-A exhibits chemical properties consistent with a heme-based gas sensor protein.
Figures


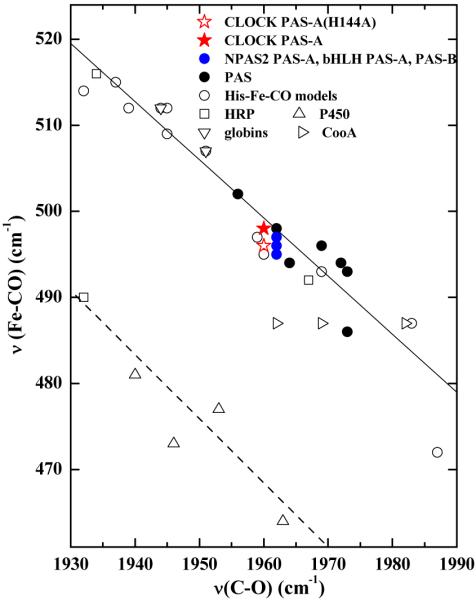
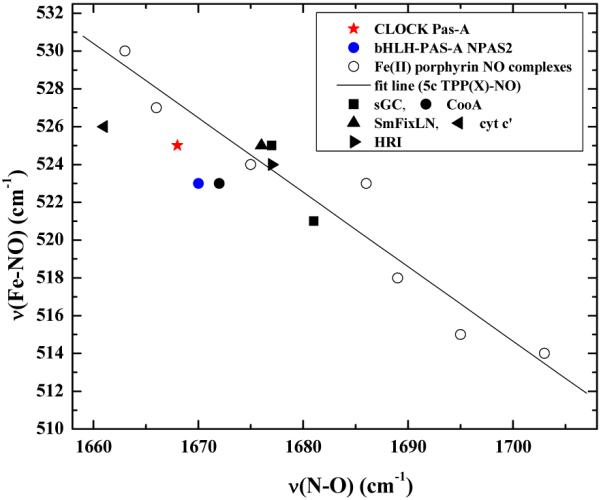
 ; globins, ▽; cytochrome P450s, △; Horseradish peroxidases, ○; CooA, □; PAS domain proteins, ● (listed in Table 2); NPAS2, Pas A and Pas B domains,
 . The dashed line correlates ν(Fe–CO) with ν(C–O) for 6c FeCO complexes in which the sixth ligand is thiolate or imidazolate; the solid line represents FeCO adducts with histidine having a neutral imidazole side chain as the sixth ligand. References for the PAS domains are listed in Table 2.
 , intermediate;
  , CO complex. Inset: Concentrations are plotted on an expanded time axis from 0 to 6 ms in order to more clearly show the appearance of the 6c intermediate at the expense of the pentacoordinate photoproduct.


Similar articles
-
Spectroscopic characterization of the isolated heme-bound PAS-B domain of neuronal PAS domain protein 2 associated with circadian rhythms.FEBS J. 2005 Aug;272(16):4153-62. doi: 10.1111/j.1742-4658.2005.04828.x. FEBS J. 2005. PMID: 16098197
-
Heme-binding characteristics of the isolated PAS-A domain of mouse Per2, a transcriptional regulatory factor associated with circadian rhythms.Biochemistry. 2008 Jun 10;47(23):6157-68. doi: 10.1021/bi7023892. Epub 2008 May 15. Biochemistry. 2008. PMID: 18479150
-
Spectroscopic and DNA-binding characterization of the isolated heme-bound basic helix-loop-helix-PAS-A domain of neuronal PAS protein 2 (NPAS2), a transcription activator protein associated with circadian rhythms.FEBS J. 2006 Jun;273(11):2528-39. doi: 10.1111/j.1742-4658.2006.05259.x. FEBS J. 2006. PMID: 16704425
-
PAS Dimerization at the Nexus of the Mammalian Circadian Clock.J Mol Biol. 2024 Feb 1;436(3):168341. doi: 10.1016/j.jmb.2023.168341. Epub 2023 Nov 2. J Mol Biol. 2024. PMID: 37924861 Free PMC article. Review.
-
Molecular components of the circadian clock in mammals.Diabetes Obes Metab. 2015 Sep;17 Suppl 1(0 1):6-11. doi: 10.1111/dom.12514. Diabetes Obes Metab. 2015. PMID: 26332962 Free PMC article. Review.
Cited by
-
Circadian dependency of microglial heme oxygenase-1 expression and inflammation determine neuronal injury in hemorrhagic stroke.J Inflamm (Lond). 2023 Dec 16;20(1):43. doi: 10.1186/s12950-023-00371-w. J Inflamm (Lond). 2023. PMID: 38104143 Free PMC article.
-
A heme-binding domain controls regulation of ATP-dependent potassium channels.Proc Natl Acad Sci U S A. 2016 Apr 5;113(14):3785-90. doi: 10.1073/pnas.1600211113. Epub 2016 Mar 22. Proc Natl Acad Sci U S A. 2016. PMID: 27006498 Free PMC article.
-
Time to target the circadian clock for drug discovery.Trends Biochem Sci. 2022 Sep;47(9):745-758. doi: 10.1016/j.tibs.2022.04.009. Epub 2022 May 13. Trends Biochem Sci. 2022. PMID: 35577675 Free PMC article. Review.
-
2,3,7,8-Tetrachlorodibenzo-p-dioxin abolishes circadian regulation of hepatic metabolic activity in mice.Sci Rep. 2019 Apr 24;9(1):6514. doi: 10.1038/s41598-019-42760-3. Sci Rep. 2019. PMID: 31015483 Free PMC article.
-
What Can Be Learned from Nuclear Resonance Vibrational Spectroscopy: Vibrational Dynamics and Hemes.Chem Rev. 2017 Oct 11;117(19):12532-12563. doi: 10.1021/acs.chemrev.7b00295. Epub 2017 Sep 18. Chem Rev. 2017. PMID: 28921972 Free PMC article. Review.
References
-
- Hirayama J, Sassone-Corsi P. Curr. Opin. Genet. Dev. 2005;15:548. - PubMed
-
- Reinking J, Lam MMS, Pardee K, Sampson HM, Liu S, Yang P, Williams S, White W, Lajoie G, Edwards A, Krause HM. Cell. 2005;122:195. - PubMed
-
- Yin L, Wu N, Curtin JC, Qatanani M, Szwergold NR, Reid RA, Waitt GM, Parks DJ, Pearce KH, Wisely GB, Lazar MA. Science. 2007;318:1786. - PubMed
Publication types
MeSH terms
Substances
Grants and funding
LinkOut - more resources
Full Text Sources
