

Enhancing the fever workup utilizing a multi-technique modeling approach to diagnose infections more accurately
- PMID: 20666579
- PMCID: PMC3318910
- DOI: 10.1089/sur.2008.057
Enhancing the fever workup utilizing a multi-technique modeling approach to diagnose infections more accurately
Abstract
Background: Differentiation between infectious and non-infectious etiologies of the systemic inflammatory response syndrome (SIRS) in trauma patients remains elusive. We hypothesized that mathematical modeling in combination with computerized clinical decision support would assist with this differentiation. The purpose of this study was to determine the capability of various mathematical modeling techniques to predict infectious complications in critically ill trauma patients and compare the performance of these models with a standard fever workup practice (identifying infections on the basis of fever or leukocytosis).
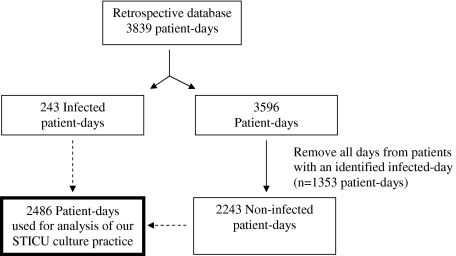
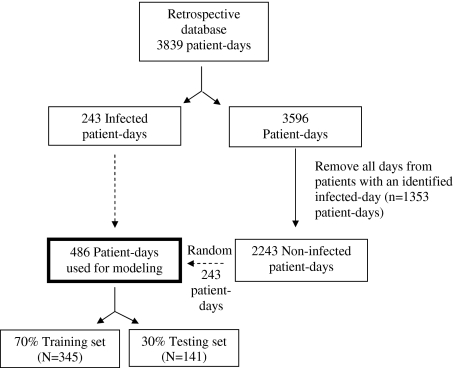
Methods: An 18-mo retrospective database was created using information collected daily from critically ill trauma patients admitted to an academic surgical and trauma intensive care unit. Two hundred forty-three non-infected patient-days were chosen randomly to combine with the 243 infected-days, which created a modeling sample of 486 patient-days. Utilizing ten variables known to be associated with infectious complications, decision trees, neural networks, and logistic regression analysis models were created to predict the presence of urinary tract infections (UTIs), bacteremia, and respiratory tract infections (RTIs). The data sample was split into a 70% training set and a 30% testing set. Models were compared by calculating sensitivity, specificity, positive predictive value, negative predictive value, overall accuracy, and discrimination.
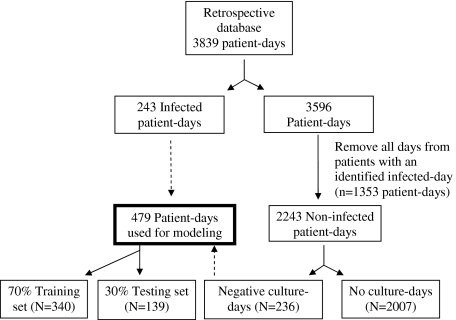
Results: Decision trees had the best modeling performance, with a sensitivity of 83%, an accuracy of 82%, and a discrimination of 0.91 for identifying infections. Both neural networks and decision trees outperformed logistic regression analysis. A second analysis was performed utilizing the same 243 infected days and only those non-infected patient-days associated with negative microbiologic cultures (n = 236). Decision trees again had the best modeling performance for infection identification, with a sensitivity of 79%, an accuracy of 83%, and a discrimination of 0.87.
Conclusion: The use of mathematical modeling techniques beyond logistic regression can improve the robustness and accuracy of predicting infections in critically ill trauma patients. Decision tree analysis appears to have the best potential to use in assisting physicians in differentiating infectious from non-infectious SIRS.
Figures
Similar articles
-
Fever and leukocytosis in critically ill trauma patients: it's not the urine.Surg Infect (Larchmt). 2008 Feb;9(1):49-56. doi: 10.1089/sur.2007.023. Surg Infect (Larchmt). 2008. PMID: 18363468
-
The "fever workup" and respiratory culture practice in critically ill trauma patients.J Crit Care. 2010 Sep;25(3):493-500. doi: 10.1016/j.jcrc.2009.08.003. Epub 2009 Oct 21. J Crit Care. 2010. PMID: 19850442
-
Fever and leukocytosis in critically ill trauma patients: it is not the blood.Am Surg. 2009 May;75(5):405-10. Am Surg. 2009. PMID: 19445292
-
Does this adult patient with suspected bacteremia require blood cultures?JAMA. 2012 Aug 1;308(5):502-11. doi: 10.1001/jama.2012.8262. JAMA. 2012. PMID: 22851117 Review.
-
Treating urinary tract infections in the elderly.Dimens Crit Care Nurs. 1999 Jan-Feb;18(1):21-7. doi: 10.1097/00003465-199901000-00004. Dimens Crit Care Nurs. 1999. PMID: 10639996 Review.
Cited by
-
State of the Art of Machine Learning-Enabled Clinical Decision Support in Intensive Care Units: Literature Review.JMIR Med Inform. 2022 Mar 3;10(3):e28781. doi: 10.2196/28781. JMIR Med Inform. 2022. PMID: 35238790 Free PMC article. Review.
-
Fever and infections in surgical intensive care: an American Association for the Surgery of Trauma Critical Care Committee clinical consensus document.Trauma Surg Acute Care Open. 2024 Jun 3;9(1):e001303. doi: 10.1136/tsaco-2023-001303. eCollection 2024. Trauma Surg Acute Care Open. 2024. PMID: 38835635 Free PMC article.
References
-
- Edwards JR. Peterson KD. Andrus ML, et al. National Healthcare Safety Network (NHSN) Report: Data summary for 2006. Am J Infect Control. 2007;35:290–301. - PubMed
-
- Hurr H. Hawley HB. Czachor JS, et al. APACHE II and ISS scores as predictors of nosocomial infections in trauma patients. Am J Infect Control. 1999;27:79–83. - PubMed
-
- Jarvis WR. Selected aspects of the socioeconomic impact of nosocomial infections: Morbidity, mortality, cost, and prevention. Infect Control Hosp Epidemiol. 1996;17:552–557. - PubMed
-
- Freischlag J. Busuttil RW. The value of postoperative fever evaluation. Surgery. 1983;94:358–363. - PubMed
-
- Hoover L. Bochicchio GV. Napolitano LM, et al. Systemic inflammatory response syndrome and nosocomial infection in trauma. J Trauma Inj Infect Crit Care. 2006;61:310–316. - PubMed
Publication types
MeSH terms
Grants and funding
LinkOut - more resources
Full Text Sources
Medical
