

Inference on population history and model checking using DNA sequence and microsatellite data with the software DIYABC (v1.0)
- PMID: 20667077
- PMCID: PMC2919520
- DOI: 10.1186/1471-2105-11-401
Inference on population history and model checking using DNA sequence and microsatellite data with the software DIYABC (v1.0)
Abstract
Background: Approximate Bayesian computation (ABC) is a recent flexible class of Monte-Carlo algorithms increasingly used to make model-based inference on complex evolutionary scenarios that have acted on natural populations. The software DIYABC offers a user-friendly interface allowing non-expert users to consider population histories involving any combination of population divergences, admixtures and population size changes. We here describe and illustrate new developments of this software that mainly include (i) inference from DNA sequence data in addition or separately to microsatellite data, (ii) the possibility to analyze five categories of loci considering balanced or non balanced sex ratios: autosomal diploid, autosomal haploid, X-linked, Y-linked and mitochondrial, and (iii) the possibility to perform model checking computation to assess the "goodness-of-fit" of a model, a feature of ABC analysis that has been so far neglected.
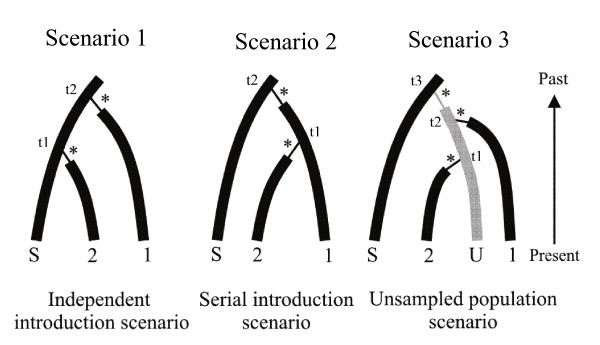
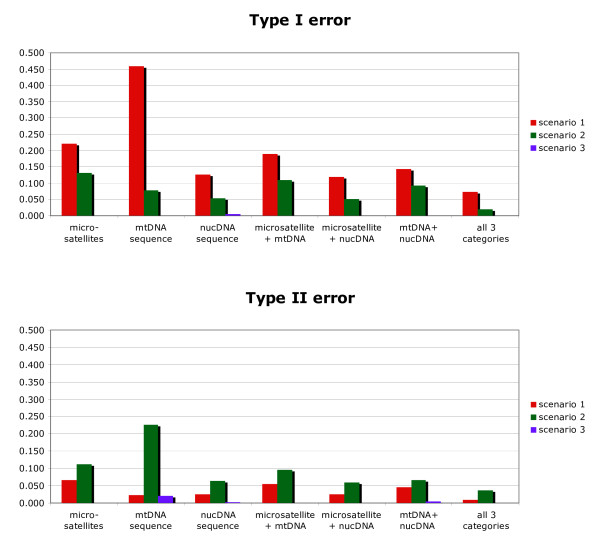
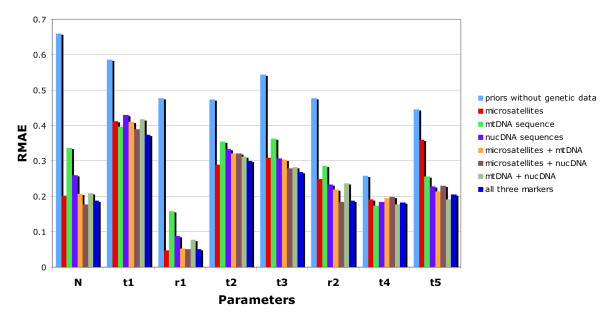
Results: We used controlled simulated data sets generated under evolutionary scenarios involving various divergence and admixture events to evaluate the effect of mixing autosomal microsatellite, mtDNA and/or nuclear autosomal DNA sequence data on inferences. This evaluation included the comparison of competing scenarios and the quantification of their relative support, and the estimation of parameter posterior distributions under a given scenario. We also considered a set of scenarios often compared when making ABC inferences on the routes of introduction of invasive species to illustrate the interest of the new model checking option of DIYABC to assess model misfit.
Conclusions: Our new developments of the integrated software DIYABC should be particularly useful to make inference on complex evolutionary scenarios involving both recent and ancient historical events and using various types of molecular markers in diploid or haploid organisms. They offer a handy way for non-expert users to achieve model checking computation within an ABC framework, hence filling up a gap of ABC analysis. The software DIYABC V1.0 is freely available at http://www1.montpellier.inra.fr/CBGP/diyabc.
Figures

Similar articles
-
Inferring population history with DIY ABC: a user-friendly approach to approximate Bayesian computation.Bioinformatics. 2008 Dec 1;24(23):2713-9. doi: 10.1093/bioinformatics/btn514. Epub 2008 Oct 7. Bioinformatics. 2008. PMID: 18842597 Free PMC article.
-
DIYABC v2.0: a software to make approximate Bayesian computation inferences about population history using single nucleotide polymorphism, DNA sequence and microsatellite data.Bioinformatics. 2014 Apr 15;30(8):1187-1189. doi: 10.1093/bioinformatics/btt763. Epub 2014 Jan 2. Bioinformatics. 2014. PMID: 24389659
-
Extending approximate Bayesian computation with supervised machine learning to infer demographic history from genetic polymorphisms using DIYABC Random Forest.Mol Ecol Resour. 2021 Nov;21(8):2598-2613. doi: 10.1111/1755-0998.13413. Epub 2021 May 21. Mol Ecol Resour. 2021. PMID: 33950563 Free PMC article.
-
On the use of kernel approximate Bayesian computation to infer population history.Genes Genet Syst. 2015;90(3):153-62. doi: 10.1266/ggs.90.153. Genes Genet Syst. 2015. PMID: 26510570 Review.
-
ABC as a flexible framework to estimate demography over space and time: some cons, many pros.Mol Ecol. 2010 Jul;19(13):2609-25. doi: 10.1111/j.1365-294X.2010.04690.x. Epub 2010 Jun 18. Mol Ecol. 2010. PMID: 20561199 Review.
Cited by
-
Molecular insights into the historic demography of bowhead whales: understanding the evolutionary basis of contemporary management practices.Ecol Evol. 2012 Jan;3(1):18-37. doi: 10.1002/ece3.374. Epub 2012 Nov 26. Ecol Evol. 2012. PMID: 23403722 Free PMC article.
-
Genetic signs of multiple colonization events in Baltic ciscoes with radiation into sympatric spring- and autumn-spawners confined to early postglacial arrival.Ecol Evol. 2014 Nov;4(22):4346-60. doi: 10.1002/ece3.1299. Epub 2014 Oct 27. Ecol Evol. 2014. PMID: 25540695 Free PMC article.
-
Genetic Diversity and Demographic History of Wild and Cultivated/Naturalised Plant Populations: Evidence from Dalmatian Sage (Salvia officinalis L., Lamiaceae).PLoS One. 2016 Jul 21;11(7):e0159545. doi: 10.1371/journal.pone.0159545. eCollection 2016. PLoS One. 2016. PMID: 27441834 Free PMC article.
-
Population Genetic Structure and Demographic History of Primula fasciculata in Southwest China.Front Plant Sci. 2020 Jul 2;11:986. doi: 10.3389/fpls.2020.00986. eCollection 2020. Front Plant Sci. 2020. PMID: 32714358 Free PMC article.
-
Autosomal STRs provide genetic evidence for the hypothesis that Tai people originate from southern China.PLoS One. 2013 Apr 8;8(4):e60822. doi: 10.1371/journal.pone.0060822. Print 2013. PLoS One. 2013. PMID: 23593317 Free PMC article.
References
-
- Bertorelle G, Bonazzo A, Mona S. ABC as a flexible framework to estimate demography over space and time: some cons, many pros. Mol Ecol. 2010. in press . - PubMed
Publication types
MeSH terms
Substances
LinkOut - more resources
Full Text Sources
Miscellaneous
