

Ambient air pollution exposure and full-term birth weight in California
- PMID: 20667084
- PMCID: PMC2919523
- DOI: 10.1186/1476-069X-9-44
Ambient air pollution exposure and full-term birth weight in California
Abstract
Background: Studies have identified relationships between air pollution and birth weight, but have been inconsistent in identifying individual pollutants inversely associated with birth weight or elucidating susceptibility of the fetus by trimester of exposure. We examined effects of prenatal ambient pollution exposure on average birth weight and risk of low birth weight in full-term births.
Methods: We estimated average ambient air pollutant concentrations throughout pregnancy in the neighborhoods of women who delivered term singleton live births between 1996 and 2006 in California. We adjusted effect estimates of air pollutants on birth weight for infant characteristics, maternal characteristics, neighborhood socioeconomic factors, and year and season of birth.
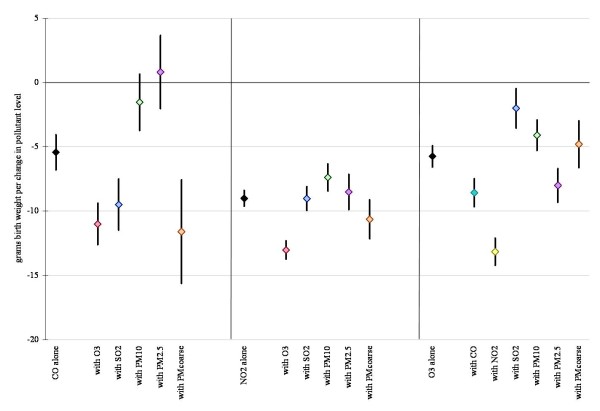
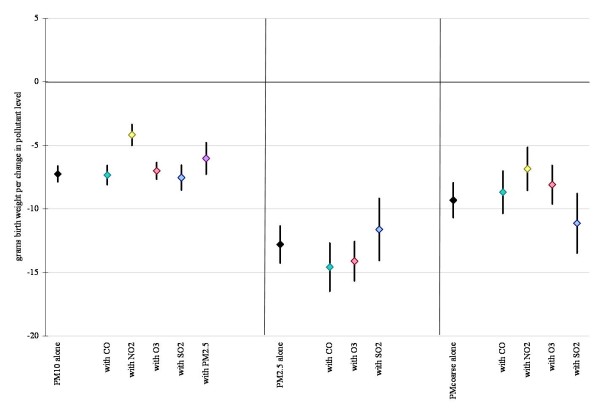
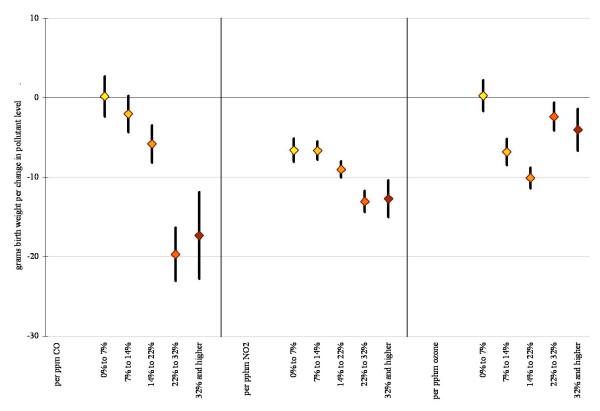
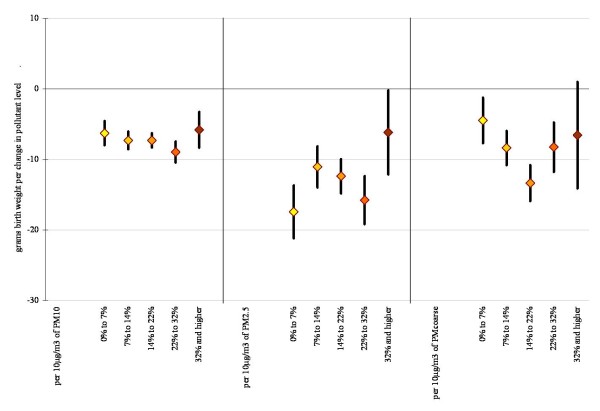
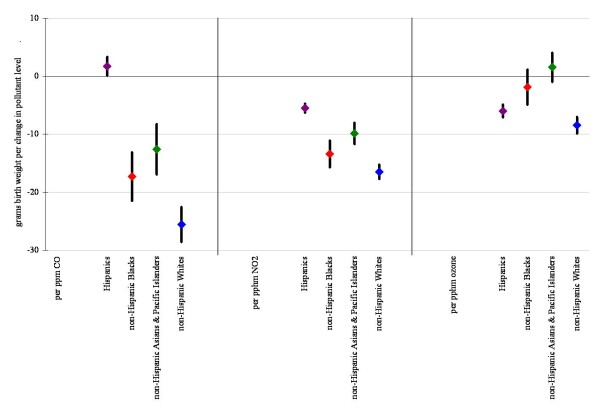
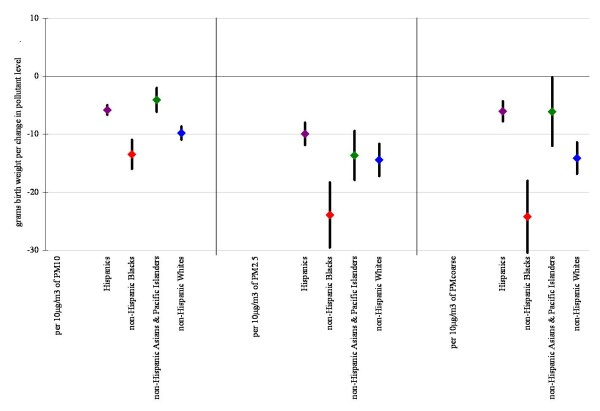
Results: 3,545,177 singleton births had monitoring for at least one air pollutant within a 10 km radius of the tract or ZIP Code of the mother's residence. In multivariate models, pollutants were associated with decreased birth weight; -5.4 grams (95% confidence interval -6.8 g, -4.1 g) per ppm carbon monoxide, -9.0 g (-9.6 g, -8.4 g) per pphm nitrogen dioxide, -5.7 g (-6.6 g, -4.9 g) per pphm ozone, -7.7 g (-7.9 g, -6.6 g) per 10 microg/m3 particulate matter under 10 microm, -12.8 g (-14.3 g, -11.3 g) per 10 microg/m3 particulate matter under 2.5 microm, and -9.3 g (-10.7 g, -7.9 g) per 10 microg/m3 of coarse particulate matter. With the exception of carbon monoxide, estimates were largely unchanged after controlling for co-pollutants. Effect estimates for the third trimester largely reflect the results seen from full pregnancy exposure estimates; greater variation in results is seen in effect estimates specific to the first and second trimesters.
Conclusions: This study indicates that maternal exposure to ambient air pollution results in modestly lower infant birth weight. A small decline in birth weight is unlikely to have clinical relevance for individual infants, and there is debate about whether a small shift in the population distribution of birth weight has broader health implications. However, the ubiquity of air pollution exposures, the responsiveness of pollutant levels to regulation, and the fact that the highest pollution levels in California are lower than those regularly experienced in other countries suggest that precautionary efforts to reduce pollutants may be beneficial for infant health from a population perspective.
Figures
Similar articles
-
Adverse Reproductive Health Outcomes and Exposure to Gaseous and Particulate-Matter Air Pollution in Pregnant Women.Res Rep Health Eff Inst. 2016;2016(188):1-58. Res Rep Health Eff Inst. 2016. PMID: 29659239 Free PMC article.
-
Birth outcomes and prenatal exposure to ozone, carbon monoxide, and particulate matter: results from the Children's Health Study.Environ Health Perspect. 2005 Nov;113(11):1638-44. doi: 10.1289/ehp.8111. Environ Health Perspect. 2005. PMID: 16263524 Free PMC article.
-
Ambient air pollution and markers of fetal growth: A retrospective population-based cohort study of 2.57 million term singleton births in China.Environ Int. 2020 Feb;135:105410. doi: 10.1016/j.envint.2019.105410. Epub 2019 Dec 26. Environ Int. 2020. PMID: 31884132
-
Ambient air pollution and pregnancy outcomes: A comprehensive review and identification of environmental public health challenges.Environ Res. 2018 Nov;167:144-159. doi: 10.1016/j.envres.2018.07.008. Epub 2018 Jul 5. Environ Res. 2018. PMID: 30014896 Review.
-
In Utero Exposure to Particulate Air Pollution during Pregnancy: Impact on Birth Weight and Health through the Life Course.Int J Environ Res Public Health. 2020 Dec 1;17(23):8948. doi: 10.3390/ijerph17238948. Int J Environ Res Public Health. 2020. PMID: 33271938 Free PMC article. Review.
Cited by
-
The Association between Ambient PM2.5 and Low Birth Weight in California.Int J Environ Res Public Health. 2022 Oct 19;19(20):13554. doi: 10.3390/ijerph192013554. Int J Environ Res Public Health. 2022. PMID: 36294135 Free PMC article.
-
A review of maternal prenatal exposures to environmental chemicals and psychosocial stressors-implications for research on perinatal outcomes in the ECHO program.J Perinatol. 2020 Jan;40(1):10-24. doi: 10.1038/s41372-019-0510-y. Epub 2019 Oct 15. J Perinatol. 2020. PMID: 31616048 Free PMC article. Review.
-
Predictive models for small-for-gestational-age births in women exposed to pesticides before pregnancy based on multiple machine learning algorithms.Front Public Health. 2022 Aug 8;10:940182. doi: 10.3389/fpubh.2022.940182. eCollection 2022. Front Public Health. 2022. PMID: 36003638 Free PMC article.
-
Low birth weight and PM2.5 in Puerto Rico.Environ Epidemiol. 2019 Aug;3(4):e058. doi: 10.1097/EE9.0000000000000058. Environ Epidemiol. 2019. PMID: 32095739 Free PMC article.
-
Flaring from Unconventional Oil and Gas Development and Birth Outcomes in the Eagle Ford Shale in South Texas.Environ Health Perspect. 2020 Jul;128(7):77003. doi: 10.1289/EHP6394. Epub 2020 Jul 15. Environ Health Perspect. 2020. PMID: 32673511 Free PMC article.
References
-
- Vital statistics of the United States. Natality. 2003;I http://www.cdc.gov/nchs/data/statab/natfinal2003.annvol1_26.pdf
-
- Mathews T, MacDorman M. Infant mortality statistics from the 2004 period linked birth/infant death data set. Natl Vital Stat Rep. 2007;55:32. - PubMed
