

Genome-wide mapping of quantitative trait loci for fatness, fat cell characteristics and fat metabolism in three porcine F2 crosses
- PMID: 20667088
- PMCID: PMC2923101
- DOI: 10.1186/1297-9686-42-31
Genome-wide mapping of quantitative trait loci for fatness, fat cell characteristics and fat metabolism in three porcine F2 crosses
Abstract
Background: QTL affecting fat deposition related performance traits have been considered in several studies and mapped on numerous porcine chromosomes. However, activity of specific enzymes, protein content and cell structure in fat tissue probably depend on a smaller number of genes than traits related to fat content in carcass. Thus, in this work traits related to metabolic and cytological features of back fat tissue and fat related performance traits were investigated in a genome-wide QTL analysis. QTL similarities and differences were examined between three F2 crosses, and between male and female animals.
Methods: A total of 966 F2 animals originating from crosses between Meishan (M), Pietrain (P) and European wild boar (W) were analysed for traits related to fat performance (11), enzymatic activity (9) and number and volume of fat cells (20). Per cross, 216 (MxP), 169 (WxP) and 195 (WxM) genome-wide distributed marker loci were genotyped. QTL mapping was performed separately for each cross in steps of 1 cM and steps were reduced when the distance between loci was shorter. The additive and dominant components of QTL positions were detected stepwise by using a multiple position model.
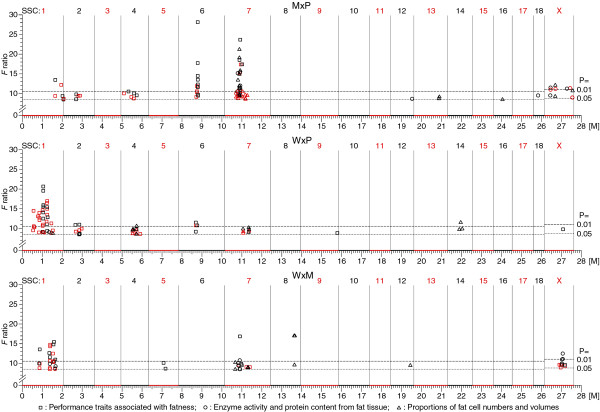
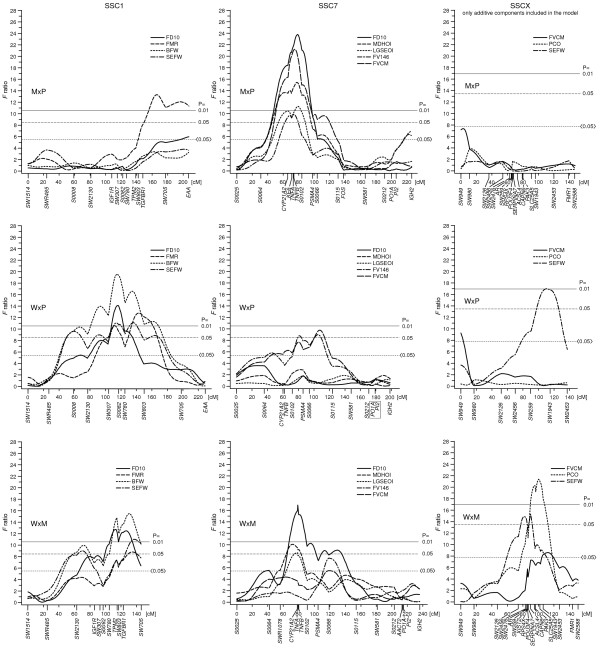
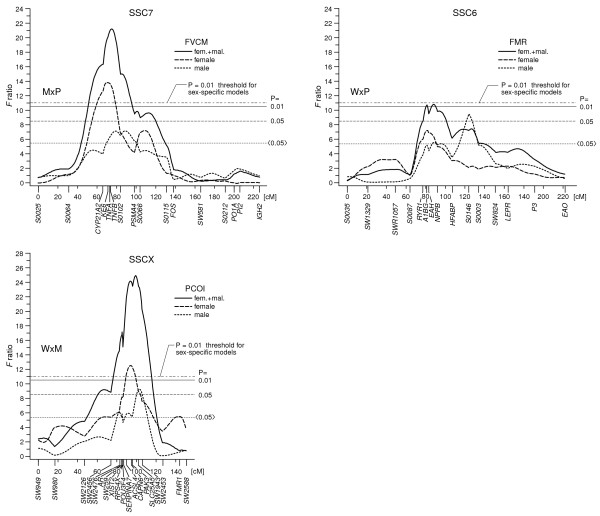
Results: A total of 147 genome-wide significant QTL (76 at P<0.05 and 71 at P<0.01) were detected for the three crosses. Most of the QTL were identified on SSC1 (between 76-78 and 87-90 cM), SSC7 (predominantly in the MHC region) and SSCX (in the vicinity of the gene CAPN6). Additional genome-wide significant QTL were found on SSC8, 12, 13, 14, 16, and 18. In many cases, the QTL are mainly additive and differ between F2 crosses. Many of the QTL profiles possess multiple peaks especially in regions with a high marker density. Sex specific analyses, performed for example on SSC6, SSC7 and SSCX, show that for some traits the positions differ between male and female animals. For the selected traits, the additive and dominant components that were analysed for QTL positions on different chromosomes, explain in combination up to 23% of the total trait variance.
Conclusions: Our results reveal specific and partly new QTL positions across genetically diverse pig crosses. For some of the traits associated with specific enzymes, protein content and cell structure in fat tissue, it is the first time that they are included in a QTL analysis. They provide large-scale information to analyse causative genes and useful data for the pig industry.
Figures
Similar articles
-
Joint QTL analysis of three connected F2-crosses in pigs.Genet Sel Evol. 2010 Nov 1;42(1):40. doi: 10.1186/1297-9686-42-40. Genet Sel Evol. 2010. PMID: 21040563 Free PMC article.
-
Quantitative trait loci associated with AutoFOM grading characteristics, carcass cuts and chemical body composition during growth of Sus scrofa.Anim Genet. 2006 Oct;37(5):435-43. doi: 10.1111/j.1365-2052.2006.01492.x. Anim Genet. 2006. PMID: 16978171
-
Combining two Meishan F2 crosses improves the detection of QTL on pig chromosomes 2, 4 and 6.Genet Sel Evol. 2010 Nov 25;42(1):42. doi: 10.1186/1297-9686-42-42. Genet Sel Evol. 2010. PMID: 21108822 Free PMC article.
-
Advances in Bayesian multiple quantitative trait loci mapping in experimental crosses.Heredity (Edinb). 2008 Mar;100(3):240-52. doi: 10.1038/sj.hdy.6801074. Epub 2007 Nov 7. Heredity (Edinb). 2008. PMID: 17987056 Free PMC article. Review.
-
QTL mapping in outbred populations: successes and challenges.Physiol Genomics. 2014 Feb 1;46(3):81-90. doi: 10.1152/physiolgenomics.00127.2013. Epub 2013 Dec 10. Physiol Genomics. 2014. PMID: 24326347 Free PMC article. Review.
Cited by
-
QTL analysis of back fat thickness and carcass pH in an F₂ intercross between Landrace and Korean native pigs.Mol Biol Rep. 2012 Aug;39(8):8327-33. doi: 10.1007/s11033-012-1682-0. Epub 2012 Jun 20. Mol Biol Rep. 2012. PMID: 22714904
-
The Duck RXRA Gene Promotes Adipogenesis and Correlates with Feed Efficiency.Animals (Basel). 2023 Feb 15;13(4):680. doi: 10.3390/ani13040680. Animals (Basel). 2023. PMID: 36830469 Free PMC article.
-
Identification of porcine glycogen synthase kinase 3α (GSK-3α) gene and its association with carcass traits.Mol Cell Biochem. 2013 May;377(1-2):65-73. doi: 10.1007/s11010-013-1571-4. Epub 2013 Jan 29. Mol Cell Biochem. 2013. PMID: 23358925
-
Progeny-testing of full-sibs IBD in a SSC2 QTL region highlights epistatic interactions for fatness traits in pigs.BMC Genet. 2011 Oct 27;12:92. doi: 10.1186/1471-2156-12-92. BMC Genet. 2011. PMID: 22032270 Free PMC article.
-
Association between polymorphism in the FTO gene and growth and carcass traits in pig crosses.Genet Sel Evol. 2012 Apr 17;44(1):13. doi: 10.1186/1297-9686-44-13. Genet Sel Evol. 2012. PMID: 22510482 Free PMC article.
References
-
- Bidanel JP, Rothschild M. Current status of quantitative trait locus mapping in pigs. PigNews Inform. 2002;23:39N–54N.
-
- Geldermann H, Müller E, Moser G, Reiner G, Bartenschlager H, Cepica S, Stratil A, Kuryl J, Moran C, Davoli R. Genome-wide linkage and QTL mapping in porcine F2 families generated from Pietrain, Meishan and Wild Boar crosses. J Anim Breed Genet. 2003;120:363–393. doi: 10.1046/j.0931-2668.2003.00408.x. - DOI
-
- Müller E, Rogdakis E. Genetische Regulation des Fettstoffwechsels beim Schwein. Hohenheimer Arbeiten, Reihe Tierische Produktion. 1985;131:7–28.
Publication types
MeSH terms
Substances
LinkOut - more resources
Full Text Sources
Research Materials
Miscellaneous
