

Gene expression profiling of monkeypox virus-infected cells reveals novel interfaces for host-virus interactions
- PMID: 20667104
- PMCID: PMC2920256
- DOI: 10.1186/1743-422X-7-173
Gene expression profiling of monkeypox virus-infected cells reveals novel interfaces for host-virus interactions
Abstract
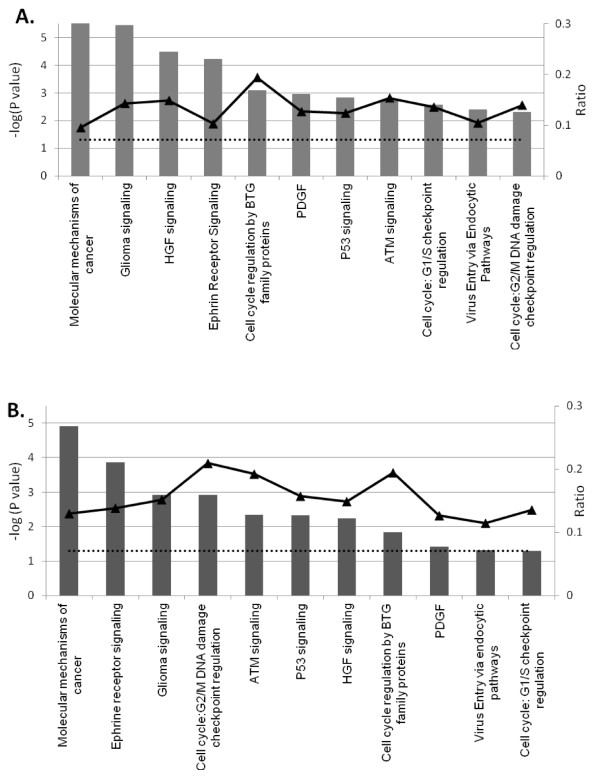
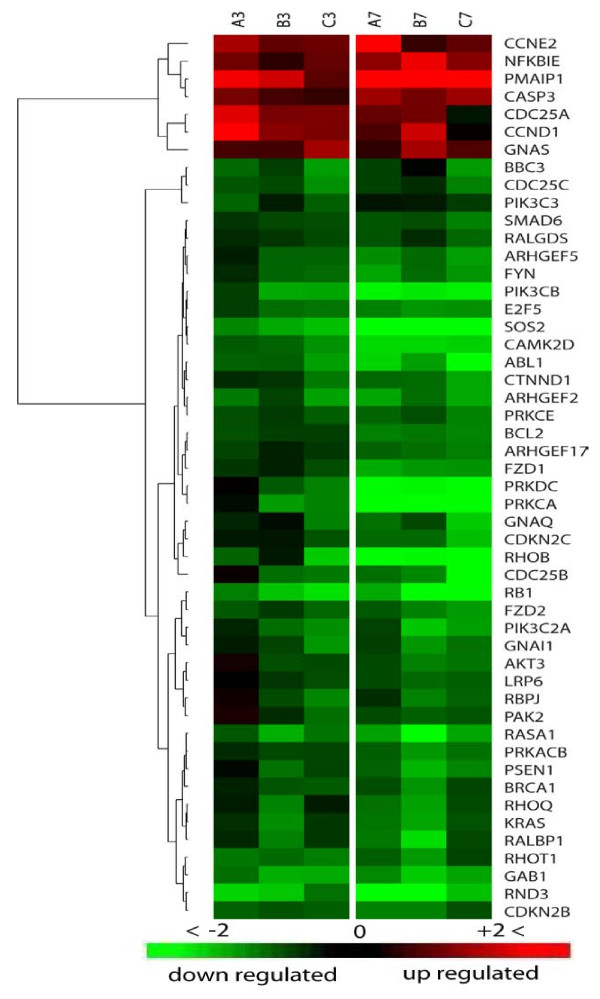
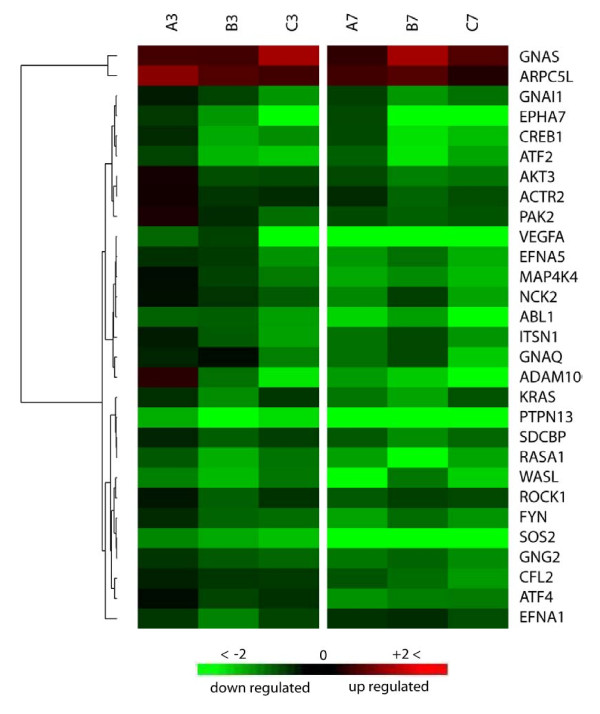
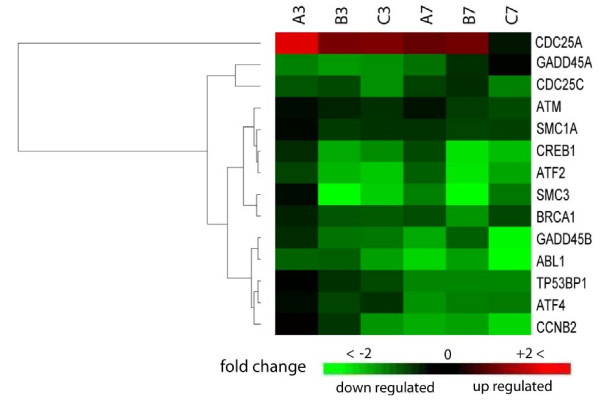
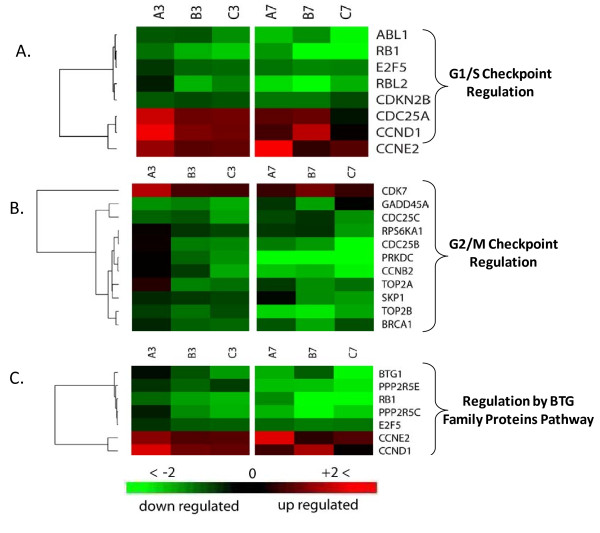
Monkeypox virus (MPV) is a zoonotic Orthopoxvirus and a potential biothreat agent that causes human disease with varying morbidity and mortality. Members of the Orthopoxvirus genus have been shown to suppress antiviral cell defenses, exploit host cell machinery, and delay infection-induced cell death. However, a comprehensive study of all host genes and virus-targeted host networks during infection is lacking. To better understand viral strategies adopted in manipulating routine host biology on global scale, we investigated the effect of MPV infection on Macaca mulatta kidney epithelial cells (MK2) using GeneChip rhesus macaque genome microarrays. Functional analysis of genes differentially expressed at 3 and 7 hours post infection showed distinctive regulation of canonical pathways and networks. While the majority of modulated histone-encoding genes exhibited sharp copy number increases, many of its transcription regulators were substantially suppressed; suggesting involvement of unknown viral factors in host histone expression. In agreement with known viral dependence on actin in motility, egress, and infection of adjacent cells, our results showed extensive regulation of genes usually involved in controlling actin expression dynamics. Similarly, a substantial ratio of genes contributing to cell cycle checkpoints exhibited concerted regulation that favors cell cycle progression in G1, S, G2 phases, but arrest cells in G2 phase and inhibits entry into mitosis. Moreover, the data showed that large number of infection-regulated genes is involved in molecular mechanisms characteristic of cancer canonical pathways. Interestingly, ten ion channels and transporters showed progressive suppression during the course of infection. Although the outcome of this unusual channel expression on cell osmotic homeostasis remains unknown, instability of cell osmotic balance and membrane potential has been implicated in intracellular pathogens egress. Our results highlight the role of histones, actin, cell cycle regulators, and ion channels in MPV infection, and propose these host functions as attractive research focal points in identifying novel drug intervention sites.
Figures
Similar articles
-
Monkeypox Virus Host Factor Screen Using Haploid Cells Identifies Essential Role of GARP Complex in Extracellular Virus Formation.J Virol. 2017 May 12;91(11):e00011-17. doi: 10.1128/JVI.00011-17. Print 2017 Jun 1. J Virol. 2017. PMID: 28331092 Free PMC article.
-
Comparison of host cell gene expression in cowpox, monkeypox or vaccinia virus-infected cells reveals virus-specific regulation of immune response genes.Virol J. 2013 Feb 20;10:61. doi: 10.1186/1743-422X-10-61. Virol J. 2013. PMID: 23425254 Free PMC article.
-
Comparison of Transcriptomic Signatures between Monkeypox-Infected Monkey and Human Cell Lines.J Immunol Res. 2022 Sep 1;2022:3883822. doi: 10.1155/2022/3883822. eCollection 2022. J Immunol Res. 2022. PMID: 36093436 Free PMC article.
-
An overview on monkeypox virus: Pathogenesis, transmission, host interaction and therapeutics.Front Cell Infect Microbiol. 2023 Feb 10;13:1076251. doi: 10.3389/fcimb.2023.1076251. eCollection 2023. Front Cell Infect Microbiol. 2023. PMID: 36844409 Free PMC article. Review.
-
Status of human monkeypox: clinical disease, epidemiology and research.Vaccine. 2011 Dec 30;29 Suppl 4:D54-9. doi: 10.1016/j.vaccine.2011.04.014. Epub 2011 Dec 18. Vaccine. 2011. PMID: 22185831 Review.
Cited by
-
Transcriptomic analysis of the effects of a fish oil enriched diet on murine brains.PLoS One. 2014 Mar 14;9(3):e90425. doi: 10.1371/journal.pone.0090425. eCollection 2014. PLoS One. 2014. PMID: 24632812 Free PMC article.
-
Poxviruses from the Concept of One Health.Adv Exp Med Biol. 2024;1451:21-33. doi: 10.1007/978-3-031-57165-7_2. Adv Exp Med Biol. 2024. PMID: 38801569 Review.
-
Monkeypox virus protein H3L induces injuries in human and mouse.Cell Death Dis. 2024 Aug 21;15(8):607. doi: 10.1038/s41419-024-06990-2. Cell Death Dis. 2024. PMID: 39168969 Free PMC article.
-
Monkeypox virus spreads from cell-to-cell and leads to neuronal death in human neural organoids.Nat Commun. 2025 Jun 30;16(1):5376. doi: 10.1038/s41467-025-61134-0. Nat Commun. 2025. PMID: 40588500 Free PMC article.
-
Transcriptome Changes in Glioma Cells upon Infection with the Oncolytic Virus VV-GMCSF-Lact.Cells. 2023 Nov 12;12(22):2616. doi: 10.3390/cells12222616. Cells. 2023. PMID: 37998351 Free PMC article.
References
MeSH terms
Associated data
- Actions
LinkOut - more resources
Full Text Sources
Other Literature Sources
Medical
Molecular Biology Databases
