. 2010 Jul 28:9:201.
doi: 10.1186/1476-4598-9-201.

MMP13 mediates cell cycle progression in melanocytes and melanoma cells: in vitro studies of migration and proliferation

Affiliations

MMP13 mediates cell cycle progression in melanocytes and melanoma cells: in vitro studies of migration and proliferation

Svenja Meierjohann et al. Mol Cancer. .

Abstract

Background: Melanoma cells are usually characterized by a strong proliferative potential and efficient invasive migration. Among the multiple molecular changes that are recorded during progression of this disease, aberrant activation of receptor tyrosine kinases (RTK) is often observed. Activation of matrix metalloproteases goes along with RTK activation and usually enhances RTK-driven migration. The purpose of this study was to examine RTK-driven three-dimensional migration of melanocytes and the pro-tumorigenic role of matrix metalloproteases for melanocytes and melanoma cells.

Results: Using experimental melanocyte dedifferentiation as a model for early melanomagenesis we show that an activated EGF receptor variant potentiates migration through three-dimensional fibrillar collagen. EGFR stimulation also resulted in a strong induction of matrix metalloproteases in a MAPK-dependent manner. However, neither MAPK nor MMP activity were required for migration, as the cells migrated in an entirely amoeboid mode. Instead, MMPs fulfilled a function in cell cycle regulation, as their inhibition resulted in strong growth inhibition of melanocytes. The same effect was observed in the human melanoma cell line A375 after stimulation with FCS. Using sh- and siRNA techniques, we could show that MMP13 is the protease responsible for this effect. Along with decreased proliferation, knockdown of MMP13 strongly enhanced pigmentation of melanocytes.

Conclusions: Our data show for the first time that growth stimuli are mediated via MMP13 in melanocytes and melanoma, suggesting an autocrine MMP13-driven loop. Given that MMP13-specific inhibitors are already developed, these results support the evaluation of these inhibitors in the treatment of melanoma.


Figures
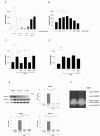
Figure 1
Figure 1
EGF induces melanocyte motility on collagen I and the expression of several matrix metalloproteases. A-D: Hm cells were serum-starved for 24 h and seeded onto the upper chamber of transwell migration inlays. The transwell migration assays were stopped after 12 h. Cells were stained with crystal violet and the number of transmigrated cells was counted. A: Hm cells were seeded onto uncoated transwell migration inlays or inlays previously coated with vitronectin (Vn), fibronectin (Fn) or collagen I (Col I). Where indicated, EGF were applied to the lower chamber. B: Transwell migration assay of Hm cells seeded onto collagen I-coated inlays. The indicated concentrations of EGF were applied to the lower chamber. C-D: Transwell migration assay of Hm cells seeded onto collagen I-coated inlays and stimulated with 1 ng/ml EGF, applied to the lower chamber. Cells were additionally treated with AG1478 (AG), LY294002 (LY), PP2, U0126 (U0) (C) or a combination of LY294002 and U0126 (LY + U0) (D). **: p < 0.001 (Student's t test, paired, two-tailed). E: Hm cells were serum-starved for 24 h and subsequently left untreated or treated with 100 ng/ml EGF in presence or absence of AG1478 or U0126. After 8 h, cells were harvested and reverse transcription-PCR (in case of Mmp1a and Mmp1b) or realtime-PCR analysis (in case of Mmp3, -9 and -13) were performed. Realtime-PCR data were normalized to expression of actin. **: p < 0.001 (Student's t test, paired, two-tailed). F: Zymographic analysis of the supernatant of starved or EGF-treated Hm cells after two days of stimulation.
Figure 2
Figure 2
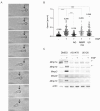
EGF induces MMP-independent amoeboid migration in Hm cells. A: Hm cells were embedded in a three-dimensional collagen matrix and overlaid with starving medium containing EGF. The pictures are a detail magnification of Additional file 3, Movie S1 and show the migrative behaviour of a single cell that was photographed eight times consecutively with a time interval of 4 min between the pictures. The arrow indicates areas of dense matrix where the cell has to contract its cell body. B: Analysis of the speed of Hm cells migrating in a three-dimensional collagen gel. Cells were embedded into collagen in the presence of DMSO, AG1478, U0126 and a mixture of MMPI 9/13 and GM6001 (Ilomastat). Where indicated, cells were overlaid with EGF-containing medium. Graphs display the speed of single cells that was calculated from the time-lapse movies, and the mean speed for each condition is indicated. The following numbers of cells were examined: ctrl., EGF, EGF + U0126: n = 161 (for each); EGF + AG1478: n = 78; EGF + MMP inhibitors: n = 120. ***: p < 0.0001. C: Hm cells were embedded in collagen matrix and stimulated with EGF as described above. The supernatant contained DMSO, AG1478 or U0126, respectively. After 8 h, where maximal stimulation was seen before, whole collagen gels were used for RNA isolation and RT-PCR analysis of the indicated genes. In case of Mmp1a and -1b a lower, unspecific DNA band was seen, which was presumably due to oligonucleotide multimers that can form in the absence of specific template. The specific bands for MMP1a and -1b are indicated by an arrow.
Figure 3
Figure 3
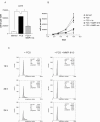
MMP inhibition results in strongly reduced proliferation of melan-a Hm cells. A: Hm cells were starved for two days in presence of 1.5% dialyzed FCS and were then stimulated by the addition of 100 ng/ml EGF, either in absence or presence of the MMP inhibitor mix containing MMP inhibitors MMPI 9/13 and Ilomastat. The number of cells per well after ten days of treatment is indicated. *: p < 0.05; **: p < 0.0001. B: Starved Hm cells were stimulated with EGF in absence or presence of Ilomastat, MMP9/13 inhibitor or a combination of both. Cell proliferation was measured after 2, 4, 6, 8 and 10 days. C: Cells were starved as above and were incubated with EGF in absence or presence of the MMP inhibitor 9/13. Their cell cycle state was monitored after 16, 20 and 24 h. The first accumulation of cells into S-phase is seen after 20 h. The assay was performed three times, and a representative example is shown.
Figure 4
Figure 4
Upregulation of human MMP13 in response to FCS. A375 cells were starved for two days in presence of 0.5% dialyzed FCS and stimulated by the addition of 100 ng/ml EGF or 10% FCS. After 4 and 8 h, cells were harvested and monitored for the expression of MMP13 by realtime PCR. Human ribosomal S14 was used as reference gene. *: p < 0.05 (Student's t test, paired, two-tailed).
Figure 5
Figure 5
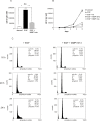
MMP inhibition results in strongly reduced proliferation of A375 cells. A: A375 cells were starved for two days in presence of 1.5% dialyzed FCS and stimulated by the addition of 10% FCS, either in absence or presence of the MMP inhibitor mix containing MMP inhibitors MMPI 9/13 and Ilomastat. The number of cells per well after ten days of treatment is indicated. B: Starved A375 cells were stimulated with FCS in absence or presence of Ilomastat, MMP9/13 inhibitor or a combination of both. Cell proliferation was measured after 2, 4, 6, 8 and 10 days. C: Cells were starved as above and were incubated with FCS in absence or presence of the MMP inhibitor 9/13. Their cell cycle state was monitored after 16, 20 and 24 h. The first accumulation of cells into S-phase is seen after 20 h. The assay was performed three times, and a representative example is shown.
Figure 6
Figure 6
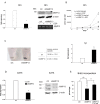
MMP13 knockdown in murine melanocytes and the human melanoma cell line A375 reduces proliferation. A, left: Realtime-PCR of Mmp13 expression in melan-a Hm cells transgenic for a control pRetroSuper vector (ctrl.) compared to melan-a Hm cells expressing pRS-shMmp13. A, right, top: Western blot displaying the decrease of the pro-form of MMP13 after knockdown in murine melan-a Hm cells. Note that only the human, but not the murine active form is recognized by the antibody (also see D). A, right, bottom: Zymography of unconcentrated supernatant, showing a decreased MMP13 band after knockdown. B: Starved melan a Hm pRS and Hm pRS-shMmp13 cells were stimulated with EGF, and cell proliferation was measured after 2, 4, 6, 8 and 10 days. C, left: Appearance of cell pellets of EGF-stimulated Hm cells either transfected with the control vector or the pRS-shMmp13 vector. C, middle panel: Quantification of melanin in EGF-stimulated Hm cells either transfected with the control vector or the pRS-shMmp13 vector. C, right: Realtime PCR analysis of tyrosinase transcript levels in control Hm cells and Hm cells expressing pRS-shMmp13. β-actin was used as reference gene. D, left: Realtime-PCR of MMP13 expression in A375 cells transfected with siRNA against MMP13 or an siRNA control, 72 h after transfection. D, right: Western blot of MMP13, showing the full-length (60 kDa) and the active (48 kDa) form of the protein in A375 cells treated with control or MMP13-specific siRNA. E: BrdU incorporation of A375 cells transfected with control siRNA or MMP13-specific siRNA. The right bar shows the BrdU incorporation of A375 cells, treated with MMP13-specific siRNA, but in presence of the 48 h-conditioned supernatant from control siRNA-transfected cells. BrdU incorporation of the control cells is used as reference and is set as 100%. The assay was performed three times independently. *: p < 0.05 (Student's t test, paired, two-tailed)

Similar articles

Cited by

References

    1. Citri A, Yarden Y. EGF-ERBB signalling: towards the systems level. Nat Rev Mol Cell Biol. 2006;7:505–516. doi: 10.1038/nrm1962. - DOI - PubMed
    1. Ramnarain DB, Park S, Lee DY, Hatanpaa KJ, Scoggin SO, Otu H, Libermann TA, Raisanen JM, Ashfaq R, Wong ET, Wu J, Elliott R, Habib AA. Differential gene expression analysis reveals generation of an autocrine loop by a mutant epidermal growth factor receptor in glioma cells. Cancer Res. 2006;66:867–874. doi: 10.1158/0008-5472.CAN-05-2753. - DOI - PubMed
    1. Bardeesy N, Kim M, Xu J, Kim RS, Shen Q, Bosenberg MW, Wong WH, Chin L. Role of epidermal growth factor receptor signaling in RAS-driven melanoma. Mol Cell Biol. 2005;25:4176–4188. doi: 10.1128/MCB.25.10.4176-4188.2005. - DOI - PMC - PubMed
    1. Lazar-Molnar E, Hegyesi H, Toth S, Falus A. Autocrine and paracrine regulation by cytokines and growth factors in melanoma. Cytokine. 2000;12:547–554. doi: 10.1006/cyto.1999.0614. - DOI - PubMed
    1. Tateishi M, Ishida T, Mitsudomi T, Kaneko S, Sugimachi K. Immunohistochemical evidence of autocrine growth factors in adenocarcinoma of the human lung. Cancer Res. 1990;50:7077–7080. - PubMed

Publication types

Substances