

Implication of synapse-related genes in bipolar disorder by linkage and gene expression analyses
- PMID: 20667171
- PMCID: PMC3525668
- DOI: 10.1017/S1461145710000714
Implication of synapse-related genes in bipolar disorder by linkage and gene expression analyses
Abstract
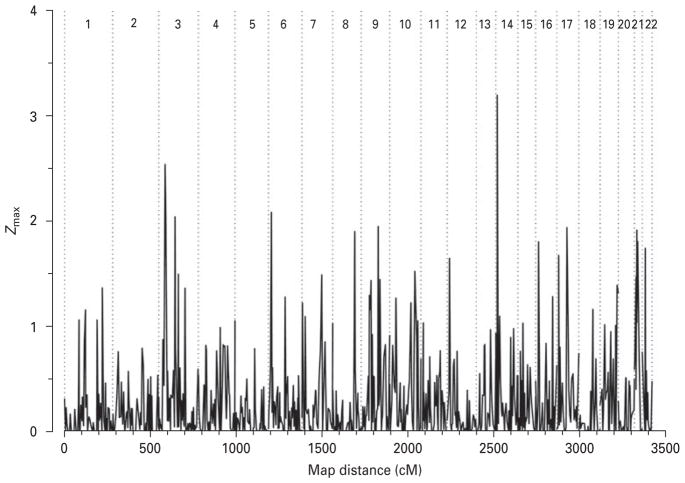
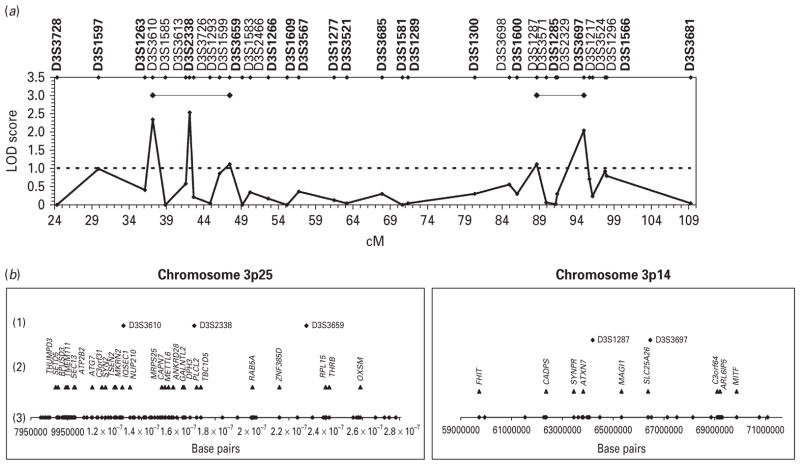
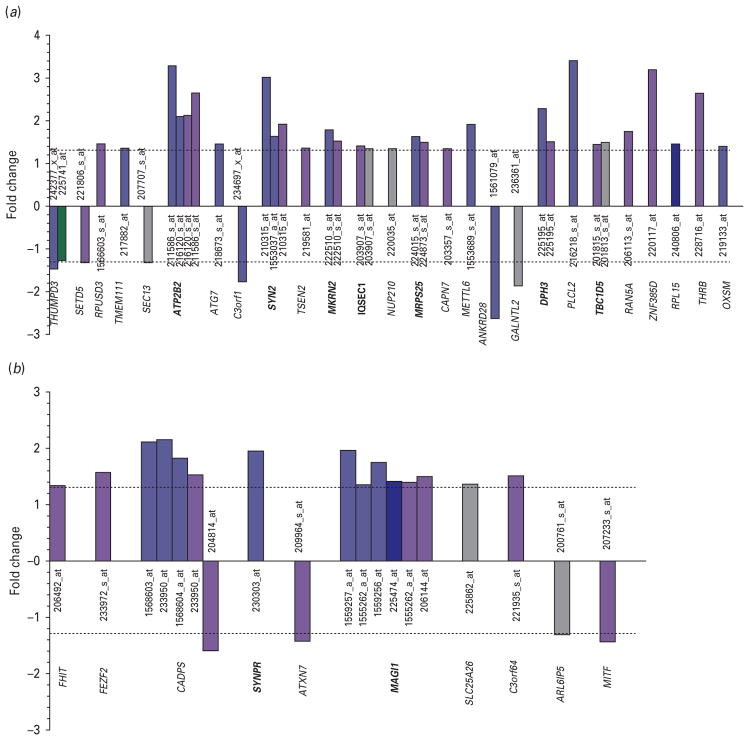
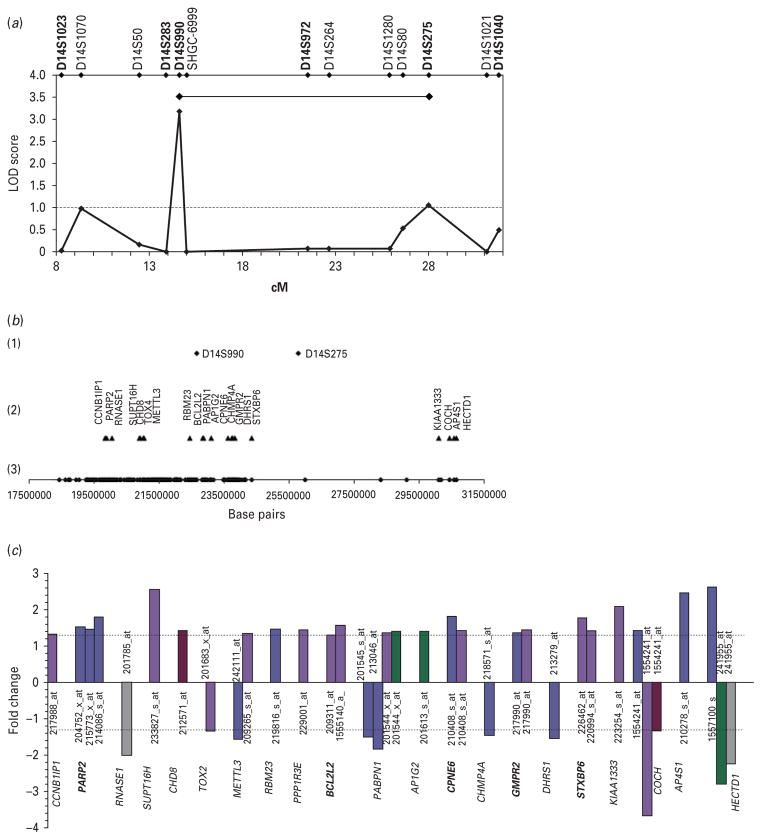
Several chromosomal regions have been linked to bipolar disorder (BD). However, the search for specific genes has been hampered by inconsistent findings, partly due to genetic and phenotypic heterogeneity. We focused on lithium-responsive bipolar patients, a subgroup thought to be more homogeneous and conducted a multistage study including an initial linkage study followed up by fine mapping and gene expression. Our sample consisted of 36 families (275 genotyped individuals, 132 affected) recruited through probands who were responders to long-term lithium treatment. We conducted a genome-wide scan with 811 microsatellite markers followed by fine mapping. Gene expression studies of candidate regions were conducted on six post-mortem prefrontal brain regions of 20 individuals (8 BD and 12 controls). We identified regions 3p25, 3p14 and 14q11 as showing the highest genome-wide linkage signal (LOD 2.53, 2.04 and 3.19, respectively). Fine mapping provided further support for 3p25, while only modest support was found in the other two regions. We identified a group of synaptic, mitochondrial and apoptotic genes with altered expression patterns in BD. Analysis of an independent microarray dataset supported the implication of synapse-related and mitochondrial genes in BD. In conclusion, using two complementary strategies, we found evidence of linkage to lithium-responsive BD on 3p25, 3p14 and 14q11 as well as significantly dysregulated genes on these regions suggesting altered synaptic and mitochondrial function in BD. Further studies are warranted to demonstrate the functional role of these genes in BD.
Conflict of interest statement
None.
Figures
Similar articles
-
Mapping susceptibility genes for bipolar disorder: a pharmacogenetic approach based on excellent response to lithium.Mol Psychiatry. 2001 Sep;6(5):570-8. doi: 10.1038/sj.mp.4000888. Mol Psychiatry. 2001. PMID: 11526471
-
Genome-wide association study identifies SESTD1 as a novel risk gene for lithium-responsive bipolar disorder.Mol Psychiatry. 2016 Sep;21(9):1290-7. doi: 10.1038/mp.2015.165. Epub 2015 Oct 27. Mol Psychiatry. 2016. PMID: 26503763 Free PMC article.
-
Association and linkage studies of candidate genes involved in GABAergic neurotransmission in lithium-responsive bipolar disorder.J Psychiatry Neurosci. 2000 Sep;25(4):353-8. J Psychiatry Neurosci. 2000. PMID: 11022400 Free PMC article.
-
Investigating responders to lithium prophylaxis as a strategy for mapping susceptibility genes for bipolar disorder.Prog Neuropsychopharmacol Biol Psychiatry. 2005 Jul;29(6):1038-45. doi: 10.1016/j.pnpbp.2005.03.021. Prog Neuropsychopharmacol Biol Psychiatry. 2005. PMID: 15946781 Review.
-
Long-term responsiveness to lithium as a pharmacogenetic outcome variable: treatment and etiologic implications.Curr Psychiatry Rep. 2003 Dec;5(6):484-92. doi: 10.1007/s11920-003-0088-z. Curr Psychiatry Rep. 2003. PMID: 14609504 Review.
Cited by
-
A gene co-expression module implicating the mitochondrial electron transport chain is associated with long-term response to lithium treatment in bipolar affective disorder.Transl Psychiatry. 2018 Sep 5;8(1):183. doi: 10.1038/s41398-018-0237-0. Transl Psychiatry. 2018. PMID: 30185780 Free PMC article.
-
Synapsin II is involved in the molecular pathway of lithium treatment in bipolar disorder.PLoS One. 2012;7(2):e32680. doi: 10.1371/journal.pone.0032680. Epub 2012 Feb 24. PLoS One. 2012. PMID: 22384280 Free PMC article.
-
The impact of phenotypic and genetic heterogeneity on results of genome wide association studies of complex diseases.PLoS One. 2013 Oct 11;8(10):e76295. doi: 10.1371/journal.pone.0076295. eCollection 2013. PLoS One. 2013. PMID: 24146854 Free PMC article.
-
Neurons derived from patients with bipolar disorder divide into intrinsically different sub-populations of neurons, predicting the patients' responsiveness to lithium.Mol Psychiatry. 2018 Jun;23(6):1453-1465. doi: 10.1038/mp.2016.260. Epub 2017 Feb 28. Mol Psychiatry. 2018. PMID: 28242870 Free PMC article.
-
The Genetics of Response to and Side Effects of Lithium Treatment in Bipolar Disorder: Future Research Perspectives.Front Pharmacol. 2021 Mar 25;12:638882. doi: 10.3389/fphar.2021.638882. eCollection 2021. Front Pharmacol. 2021. PMID: 33867988 Free PMC article. Review.
References
-
- Alda M. The phenotypic spectra of bipolar disorder. European Neuropsychopharmacology. 2004;14 (Suppl 2):S94–S99. - PubMed
-
- Alda M, Grof E, Cavazzoni P, Duffy A, et al. Autosomal recessive inheritance of affective disorders in families of responders to lithium prophylaxis? Journal of Affective Disorders. 1997;44:153–157. - PubMed
-
- American Psychiatric Association. Diagnostic and Statistical Manual of Mental Disorders. Washington, DC: American Psychiatric Press; 1994.
-
- Badner JA, Gershon ES. Meta-analysis of whole-genome linkage scans of bipolar disorder and schizophrenia. Molecular Psychiatry. 2002;7:405–411. - PubMed
-
- Baldessarini RJ, Tondo L. Does lithium treatment still work? evidence of stable responses over three decades. Archives of General Psychiatry. 2000;57:187–190. - PubMed
