. 2010 Oct 8;285(41):31446-61.
doi: 10.1074/jbc.M110.122895. Epub 2010 Jul 28.

NMR structure and ion channel activity of the p7 protein from hepatitis C virus

Affiliations

NMR structure and ion channel activity of the p7 protein from hepatitis C virus

Roland Montserret et al. J Biol Chem. .

Abstract

The small membrane protein p7 of hepatitis C virus forms oligomers and exhibits ion channel activity essential for virus infectivity. These viroporin features render p7 an attractive target for antiviral drug development. In this study, p7 from strain HCV-J (genotype 1b) was chemically synthesized and purified for ion channel activity measurements and structure analyses. p7 forms cation-selective ion channels in planar lipid bilayers and at the single-channel level by the patch clamp technique. Ion channel activity was shown to be inhibited by hexamethylene amiloride but not by amantadine. Circular dichroism analyses revealed that the structure of p7 is mainly α-helical, irrespective of the membrane mimetic medium (e.g. lysolipids, detergents, or organic solvent/water mixtures). The secondary structure elements of the monomeric form of p7 were determined by (1)H and (13)C NMR in trifluoroethanol/water mixtures. Molecular dynamics simulations in a model membrane were combined synergistically with structural data obtained from NMR experiments. This approach allowed us to determine the secondary structure elements of p7, which significantly differ from predictions, and to propose a three-dimensional model of the monomeric form of p7 associated with the phospholipid bilayer. These studies revealed the presence of a turn connecting an unexpected N-terminal α-helix to the first transmembrane helix, TM1, and a long cytosolic loop bearing the dibasic motif and connecting TM1 to TM2. These results provide the first detailed experimental structural framework for a better understanding of p7 processing, oligomerization, and ion channel gating mechanism.


Figures
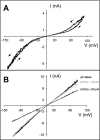
FIGURE 1.
FIGURE 1.
Current-voltage relationship of p7 as measured by the response to a slow potential ramp of ±150 mV to an asolectin bilayer. p7 protein (5 nmol of 10 μm p7 stock solution in 1% DM) was added to the cis side of the membrane bathed in 500 mm KCl, 10 mm HEPES, pH 7.4. The arrows indicate the direction of the applied voltage ramp. A, I/V curve of p7. B, I/V curve of p7 in the presence of HMA. Note that the I/V curve in A shows a low rectification of the current and an asymmetric current (more current at negative potential). In the I/V curve in B, the current is still asymmetric (always a larger current at negative potential), but the rectification is minimal. This is due to the fact that the amount of p7 protein incorporated into the bilayer is more important that in A.
FIGURE 2.
FIGURE 2.
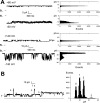
Single-channel recordings of p7 reconstituted into asolectin liposomes and examined by the patch clamp technique in 500 mm KCl, 10 mm HEPES, pH 7.4. A, channel activity is shown at two positive pipette holding potentials and at their negative corresponding potentials. The base line (BL) is shown as a horizontal line. The protein/lipid ratio is 1:5,000. An associated amplitude histogram is displayed to the right of each recording. B, channel activity is shown at a pipette holding potential of +140 mV. The protein/lipid ratio is 1:2,000. The numbers 0, 1, 2, and 3 represent the major conductance levels encountered in the selected recording, as illustrated in the associated amplitude histogram. Level 0 corresponds to the closed state of the channel, and levels 1, 2, and 3 correspond to conductance values of 57, 120, and 184 pS, respectively. From the current-amplitude histogram, it seems that the three detected levels could represent the insertion of simultaneous channels (level 1, one channel; level 2, two channels; level 3, three channels).
FIGURE 3.
FIGURE 3.
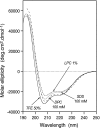
Far-UV CD analyses of p7 in various membrane mimetic environments. CD spectra were recorded in 5 mm sodium phosphate buffer, pH 7.5, complemented with either 1% l-α-lysophosphatidylcholine (LPC; small dashed line), 100 mm SDS (dotted line), 100 mm DPC (large dashed line), or 50% TFE (solid line).
FIGURE 4.
FIGURE 4.
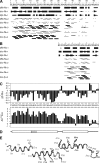
NMR analysis and structure calculation of p7 in TFE 50%. A and B, summary of sequential (i, i + 1) and medium range (i, i + 2 to i + 4) NOEs for full-length p7 and p7(35–63) peptides, respectively. Intensities of NOEs are indicated by bar thickness; asterisks indicate that the presence of a NOE is not confirmed because of resonance overlap. C, chemical shift differences for 1Hα and 13Cα at each position. These differences were calculated by subtraction of the experimental values from the random coil conformation values (43, 44). A comparison of chemical shift differences observed for segment 35–63 of full-length p7 and p7(35–63) peptides is available in supplemental Fig. S3. D, secondary structure elements deduced from the NMR data. The boxes indicate the helical elements. The gray boxes highlight some particular features within the helical elements (see “Results”). E, ribbon representations of NMR average calculated structures of p7 segments 1–18 (left), 18–39 (medium), and of p7(35–63) (right) (see “Results” for details). Cα–Cβ bonds of the polar residues (Thr, Ser, Glu, Asn, Lys, and Arg) are represented. The aromatic side chains of Phe, Tyr, and Trp as well as the cyclic side chains of Pro and His are displayed. The polar residues, including Gly, are colored light gray, and the other residues are dark gray.
FIGURE 5.
FIGURE 5.
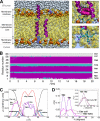
Model of the monomeric p7 protein inserted in a fully hydrated POPC bilayer. A, representative snapshot of the p7 peptide in the POPC bilayer during MD simulation. The protein backbone structure is depicted in a ribbon and tube representation. Purple ribbons denote α-helices, whereas cyan tubes correspond to turns. Random coils are shown as light gray tubes. The model lipid membrane is described by means of a semitransparent space-filling representation of POPC molecules, with the phosphorus atoms displayed as glossy orange van der Waals spheres. The positively charged Lys33, Arg35, and Arg60 residues interacting with the headgroup region of the lipid bilayer are highlighted in a blue, semitransparent representation. Water molecules are represented as light blue van der Waals spheres. Right top inset, close up of the TM1-TM2 interaction, whereby a double π-π stacking contributes to the overall stability of the α-helix bundle. Right bottom inset, interaction of the positively charged Lys33 and Arg35 residues located at the tip of the hairpin with the headgroup region of the POPC lipids. B, evolution of the secondary structure of p7 as a function of time. The secondary structure of the protein was determined with the STRIDE program (59). Color coding is as in A. Nter helix, N-terminal helix; Cter coil, C-terminal coil segment. C, density profiles for the different components of the molecular assembly depicted in A, determined from an average over the last 10 ns of the simulation. D, Jacobian corrected probability distribution of the angle ϕ formed by the longitudinal axis of either TM1, TM2, the N-terminal α-helix, or the C-terminal random coil and the normal to the water-membrane interface. Inset, probability distribution of the angle ϕ formed by the contiguous TM1-TM2 and N-terminal α-helix-TM1 segments. All image rendering in this figure was performed with the VMD program (49). The atomic coordinates for the representative p7 model in POPC bilayer during MD simulation is available at the IBCP website.
FIGURE 6.
FIGURE 6.
Variability of p7 and tentative model of p7 ion channel. A, multiple alignments of p7 sequences from representative HCV strains of confirmed genotypes (listed in Table 1 in Ref. 2). Genotype, accession number, and strain are indicated for each sequence. Amino acids are numbered with respect to p7, and the polyprotein of HCV strain H77 was used as a reference (77) (top row). The consensus sequence (top row) was deduced from the ClustalW multiple alignment of the indicated p7 sequences (30). To highlight the amino acids variability at each position, amino acids identical to the consensus sequence are indicated by hyphens. The degree of amino acid physicochemical conservation at each position can be inferred with the similarity index according to ClustalW convention (asterisk, invariant; colon, highly similar; dot, similar) (30) and the consensus hydropathic pattern: o, hydrophobic position (Phe, Ile, Trp, Tyr, Leu, Val, Met, Pro, Cys); n, neutral position (Gly, Ala, Thr, Ser); i, hydrophilic position (Lys, Gln, Asn, His, Glu, Asp, Arg); b, basic position; v, variable position (i.e. when both hydrophobic and hydrophilic residues are observed at a given position); strictly conserved amino acids in all genotypes are indicated with their one-letter code. To highlight the variable sequence positions in p7, conserved hydrophilic and hydrophobic positions are highlighted in yellow and gray, respectively. Polar and positively and negatively charged residues are color-coded in orange, blue, and red, respectively. Cysteine residues are in green, and all other residues are in black. Amino acids of the p7 sequence used in this study (1b mutC27A HCV-J, bottom raw) are colored accordingly, except for Trp and Tyr, which are colored magenta and purple, respectively, according to the p7 structure representation shown in C (see below). B, schematic representation of helical, turn, and loop regions deduced from the NMR structure analysis (see Fig. 4). C, side view of the p7 representative monomer structure in the POPC bilayer showing the putative helix side and residues facing the ion channel. The corresponding p7 amino acid sequence is shown in A (HCV-J strain). The structure backbone is represented as a ribbon, and only some amino acid side chains are shown, including residues likely to be involved in interhelix interactions, residues expected to be oriented toward the ion channel (boxed labels), basic residues of the cytosolic loop, and some residues to provide a visual reference for the orientation of p7. Yellow, Ser, Thr, and Asn; green, Cys; cyan, His; blue, Arg and Lys; red, Glu; magenta, Trp; purple, Tyr; black, Pro; gray, any other residues. The polar heads and hydrophobic tails of phospholipids (thin stick structures) are light gray and orange, respectively. D, tentative representation of p7 monomer within a putative ion channel oligomer. A 180° rotation is applied between the two structures. Images in C and D were generated from structure coordinated using the VMD program (49) and rendered with POV-Ray.

References

    1. Poynard T., Yuen M. F., Ratziu V., Lai C. L. (2003) Lancet 362, 2095–2100 - PubMed
    1. Simmonds P., Bukh J., Combet C., Deléage G., Enomoto N., Feinstone S., Halfon P., Inchauspé G., Kuiken C., Maertens G., Mizokami M., Murphy D. G., Okamoto H., Pawlotsky J. M., Penin F., Sablon E., Shin-I T., Stuyver L. J., Thiel H. J., Viazov S., Weiner A. J., Widell A. (2005) Hepatology 42, 962–973 - PubMed
    1. Combet C., Garnier N., Charavay C., Grando D., Crisan D., Lopez J., Dehne-Garcia A., Geourjon C., Bettler E., Hulo C., Le Mercier P., Bartenschlager R., Diepolder H., Moradpour D., Pawlotsky J. M., Rice C. M., Trépo C., Penin F., Deléage G. (2007) Nucleic Acids Res. 35, D363–D366 - PMC - PubMed
    1. Lindenbach B. D., Thiel H. J., Rice C. M. (2007) in Fields Virology, 5th Ed., Vol. 1 (Knipe D. M., Howley P. M. eds) pp. 1101–1152, Lippincott-Raven Publishers, Philadelphia, PA
    1. Moradpour D., Penin F., Rice C. M. (2007) Nat. Rev. Microbiol. 5, 453–463 - PubMed

Publication types

MeSH terms

Associated data

LinkOut - more resources