. 2010 Oct;84(19):9957-66.
doi: 10.1128/JVI.00930-10. Epub 2010 Jul 28.

Molecular analysis of H7 avian influenza viruses from Australia and New Zealand: genetic diversity and relationships from 1976 to 2007

Affiliations

Molecular analysis of H7 avian influenza viruses from Australia and New Zealand: genetic diversity and relationships from 1976 to 2007

Dieter Bulach et al. J Virol. 2010 Oct.

Abstract

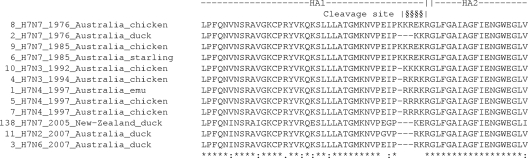
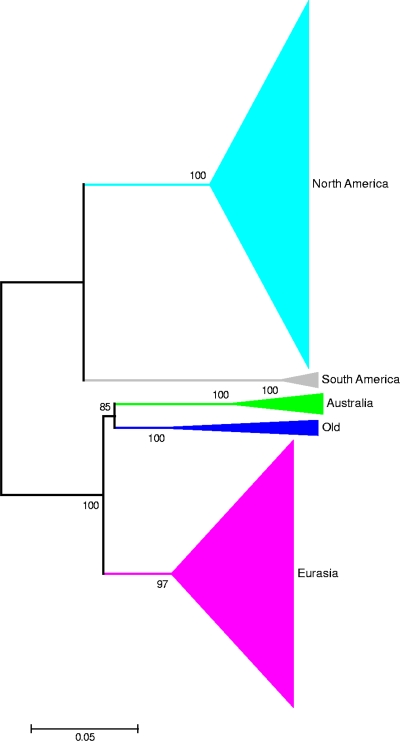
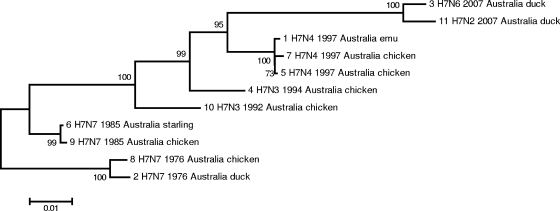
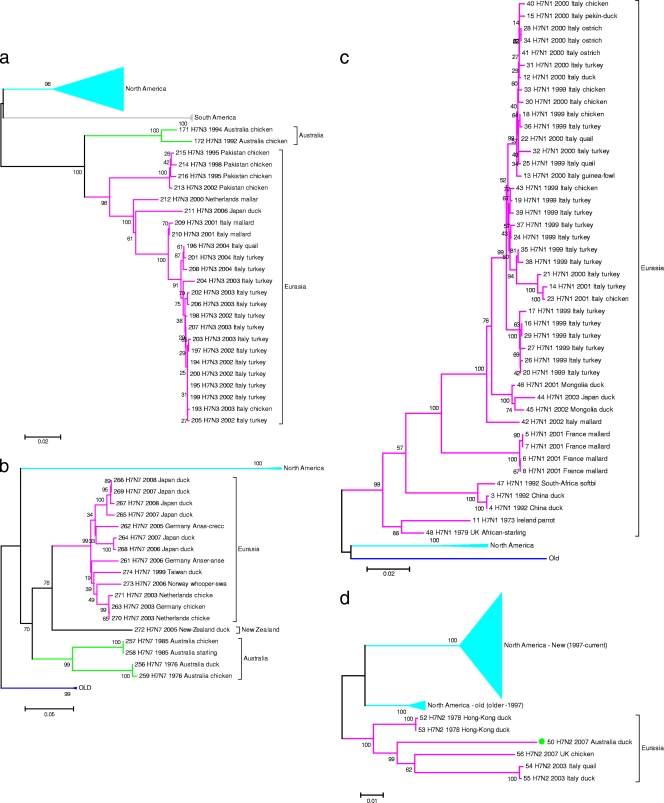
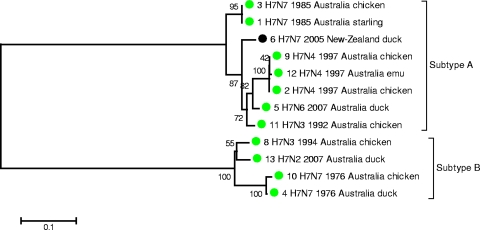
Full-genome sequencing of 11 Australian and 1 New Zealand avian influenza A virus isolate (all subtype H7) has enabled comparison of the sequences of each of the genome segments to those of other subtype H7 avian influenza A viruses. The inference of phylogenetic relationships for each segment has been used to develop a model of the natural history of these viruses in Australia. Phylogenetic analysis of the hemagglutinin segment indicates that the Australian H7 isolates form a monophyletic clade. This pattern is consistent with the long-term, independent evolution that is, in this instance, associated with geographic regions. On the basis of the analysis of the other H7 hemagglutinin sequences, three other geographic regions for which similar monophyletic clades have been observed were confirmed. These regions are Eurasia plus Africa, North America, and South America. Analysis of the neuraminidase sequences from the H7N1, H7N3, and H7N7 genomes revealed the same region-based relationships. This pattern of independent evolution of Australian isolates is supported by the results of analysis of each of the six remaining genomic segments. These results, in conjunction with the occurrence of five different combinations of neuraminidase subtypes (H7N2, H7N3, H7N4, H7N6, H7N7) among the 11 Australian isolates, suggest that the maintenance host(s) is nearly exclusively associated with Australia. The single lineage of Australian H7 hemagglutinin sequences, despite the occurrence of multiple neuraminidase types, suggests the existence of a genetic pool from which a variety of reassortants arise rather than the presence of a small number of stable viral clones. This pattern of evolution is likely to occur in each of the regions mentioned above.


Figures

FIG. 1.
FIG. 1.
Alignment of the protein sequence near the HA cleavage site for the Australian and New Zealand isolates. The top line shows the protein from which the sequence is derived. The cleavage site region is indicated by §.
FIG. 2.
FIG. 2.
Inferred relationships for 371 subtype H7 protein-coding sequences for HA0. Clades based on geographic regions are shown. Individual taxa are not shown on the tree; the size of the shaded area is proportional to the number of taxa. The evolutionary history was inferred using the minimum-evolution method. The optimal tree with the sum of branch length of 3.05693659 is shown. The percentage of replicate trees in which the associated taxa clustered together in the bootstrap test (100 replicates) is shown next to the branches. The tree is drawn to scale, with branch lengths being in the same units as those of the evolutionary distances used to infer the phylogenetic tree. The evolutionary distances were computed using the maximum-composite-likelihood method and are in units of the number of base substitutions per site. The minimum-evolution tree was searched using the close-neighbor-interchange algorithm at a search level of 1. The neighbor-joining algorithm was used to generate the initial tree. All positions containing gaps and missing data were eliminated from the data set (complete deletion option). There were a total of 1,557 positions in the final data set. Phylogenetic analyses were conducted in the MEGA4 program (29).
FIG. 3.
FIG. 3.
Inferred relationships for the 11 subtype H7 protein-coding sequences for HA0 showing the chronological relationship between the Australian isolates. The evolutionary history was inferred using the minimum-evolution method. The optimal tree with the sum of branch length of 0.19747488 is shown. The percentage of replicate trees in which the associated taxa clustered together in the bootstrap test (500 replicates) is shown next to the branches. The tree is drawn to scale, with branch lengths being in the same units as those of the evolutionary distances used to infer the phylogenetic tree. The evolutionary distances were computed using the maximum-composite-likelihood method and are in units of the number of base substitutions per site. The minimum-evolution tree was searched using the close-neighbor-interchange algorithm at a search level of 1. The neighbor-joining algorithm was used to generate the initial tree. The codon positions included were 1st + 2nd + 3rd + noncoding. All positions containing gaps and missing data were eliminated from the data set (complete deletion option). There were a total of 1,674 positions in the final data set. Phylogenetic analyses were conducted in the MEGA4 program (29).
FIG. 4
FIG. 4
(a) Inferred relationships for 79 H7N3 neuraminidase protein-coding regions. The tree shows the relationships between the major geographic clades of the H7N3 neuraminidase protein-coding region. The optimal tree with the sum of branch length of 0.81060971 is shown. There were a total of 1,247 positions in the final data set. (b) Inferred relationships for 23 H7N7 neuraminidase protein-coding regions. The tree shows the relationships between the major geographic clades of the H7N7 neuraminidase protein-coding region. The optimal tree with the sum of branch length of 0.88321959 is shown. There were a total of 527 positions in the final data set. (c) Inferred relationships for 48 H7N1 neuraminidase protein-coding regions. The tree shows the relationships between the major geographic clades of the H7N1 neuraminidase protein-coding region. The optimal tree with the sum of branch length of 0.52780887 is shown. There were a total of 1,271 positions in the final data set. (d) Inferred relationships for 121 H7N2 neuraminidase protein-coding regions. The tree shows the relationships between the major geographic clades of the H7N2 neuraminidase protein-coding region. The optimal tree with the sum of branch length of 0.64898981 is shown. There were a total of 1,312 positions in the final data set. (a to d) The evolutionary histories were inferred using the minimum-evolution method. The percentage of replicate trees in which the associated taxa clustered together in the bootstrap test (500 replicates) is shown next to the branches. The trees are drawn to scale, with the branch lengths being in the same units as those of the evolutionary distances used to infer the phylogenetic tree. The evolutionary distances were computed using the maximum-composite-likelihood method and are in units of the number of base substitutions per site. The trees were searched using the close-neighbor-interchange algorithm at a search level of 1. The neighbor-joining algorithm was used to generate the initial trees. All positions containing gaps and missing data were eliminated from the data set (complete deletion option). Phylogenetic analyses were conducted in the MEGA4 program (29). Virus name and sequence number for each taxon are listed in Table S2 in the supplemental material.
FIG. 5.
FIG. 5.
Inferred relationships for the NS1 protein-coding regions of the 12 subtype H7 isolates from Australia and New Zealand. Subtypes A and B are indicated. The evolutionary history was inferred using the minimum-evolution method. The optimal tree with the sum of branch length of 1.16593153 is shown. The percentage of replicate trees in which the associated taxa clustered together in the bootstrap test (500 replicates) is shown next to the branches. The tree is drawn to scale, with the branch lengths being in the same units as those of the evolutionary distances used to infer the phylogenetic tree. The evolutionary distances were computed using the maximum-composite-likelihood method and are in units of the number of base substitutions per site. The minimum-evolution tree was searched using the close-neighbor-interchange algorithm at a search level of 1. The neighbor-joining algorithm was used to generate the initial tree. The codon positions included were the 1st + 2nd + 3rd + noncoding. All positions containing gaps and missing data were eliminated from the data set (complete deletion option). There were a total of 693 positions in the final data set. Phylogenetic analyses were conducted in the MEGA4 program (29).

Similar articles

Cited by

References

    1. Alexander, D. J. 2003. Should we change the definition of avian influenza for eradication purposes? Avian Dis. 47:976-981. - PubMed
    1. Alexander, D. J., W. H. Allan, D. G. Parsons, and G. Parsons. 1978. Pathogenicity of 4 avian influenza-viruses for fowls, turkeys and ducks. Res. Vet. Sci. 24:242-247. - PubMed
    1. Banks, J., E. C. Speidel, J. W. McCauley, and D. J. Alexander. 2000. Phylogenetic analysis of H7 haemagglutinin subtype influenza A viruses. Arch. Virol. 145:1047-1058. - PubMed
    1. Bao, Y. M., P. Bolotov, D. Dernovoy, B. Kiryutin, L. Zaslavsky, T. Tatusova, J. Ostell, and D. Lipman. 2008. The influenza virus resource at the National Center for Biotechnology Information. J. Virol. 82:596-601. - PMC - PubMed
    1. Barr, D. A., A. P. Kelly, R. T. Badman, A. R. Campey, M. D. Orourke, D. C. Grix, and R. L. Reece. 1986. Avian influenza on a multi-age chicken farm. Aust. Vet. J. 63:195-196. - PubMed

Publication types

MeSH terms

Substances