. 2010 Oct;84(19):10241-53.
doi: 10.1128/JVI.00585-10. Epub 2010 Jul 28.

P body-associated protein Mov10 inhibits HIV-1 replication at multiple stages

Affiliations

P body-associated protein Mov10 inhibits HIV-1 replication at multiple stages

Ryan Burdick et al. J Virol. 2010 Oct.

Abstract

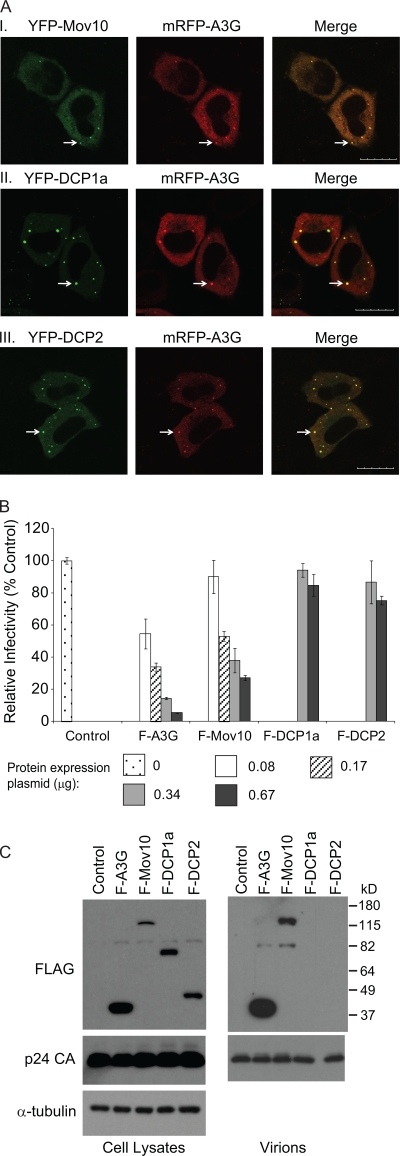
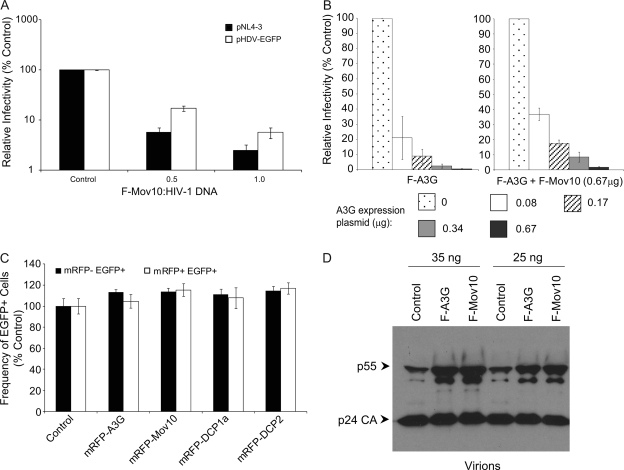
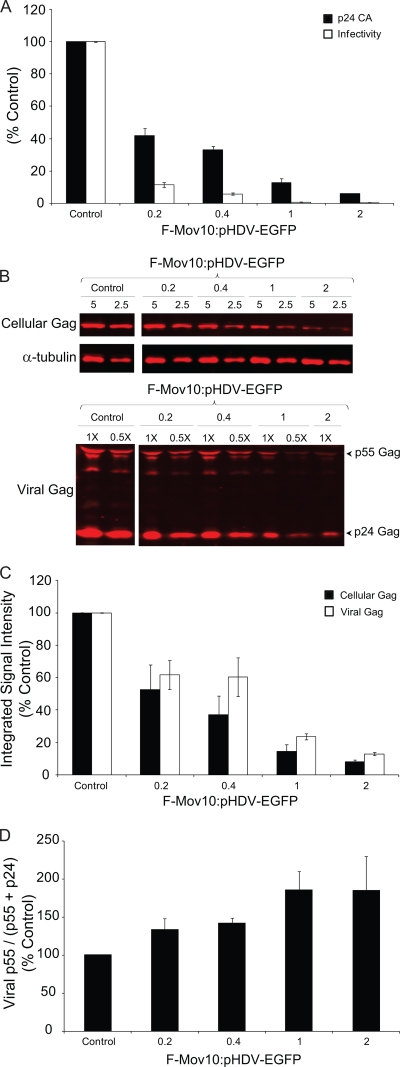
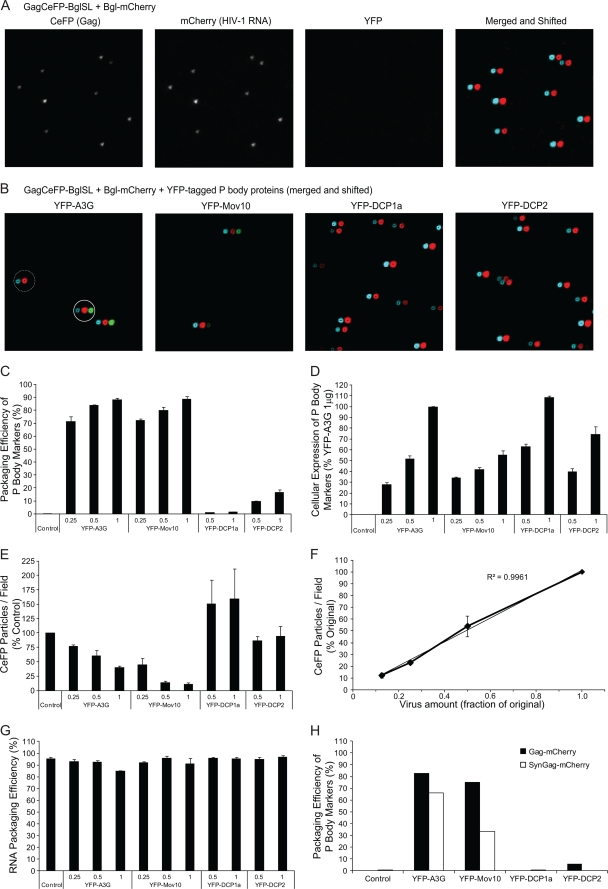
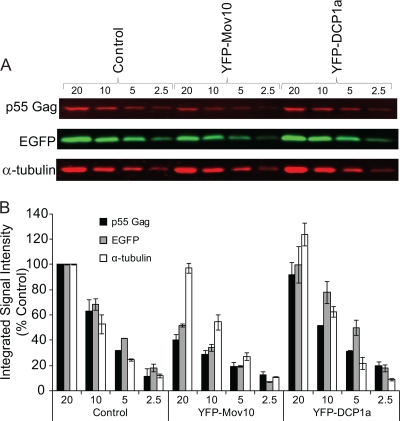
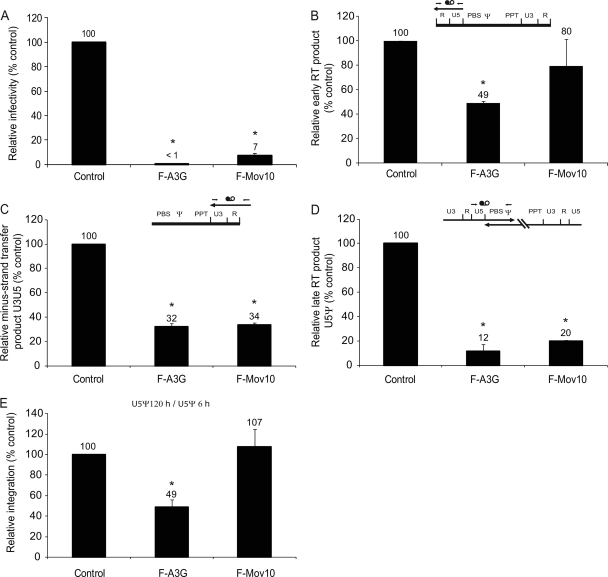
Recent studies have shown that APOBEC3G (A3G), a potent inhibitor of human immunodeficiency virus type 1 (HIV-1) replication, is localized to cytoplasmic mRNA-processing bodies (P bodies). However, the functional relevance of A3G colocalization with P body marker proteins has not been established. To explore the relationship between HIV-1, A3G, and P bodies, we analyzed the effects of overexpression of P body marker proteins Mov10, DCP1a, and DCP2 on HIV-1 replication. Our results show that overexpression of Mov10, a putative RNA helicase that was previously reported to belong to the DExD superfamily and was recently reported to belong to the Upf1-like group of helicases, but not the decapping enzymes DCP1a and DCP2, leads to potent inhibition of HIV-1 replication at multiple stages. Mov10 overexpression in the virus producer cells resulted in reductions in the steady-state levels of the HIV-1 Gag protein and virus production; Mov10 was efficiently incorporated into virions and reduced virus infectivity, in part by inhibiting reverse transcription. In addition, A3G and Mov10 overexpression reduced proteolytic processing of HIV-1 Gag. The inhibitory effects of A3G and Mov10 were additive, implying a lack of functional interaction between the two inhibitors. Small interfering RNA (siRNA)-mediated knockdown of endogenous Mov10 by 80% resulted in a 2-fold reduction in virus production but no discernible impact on the infectivity of the viruses after normalization for the p24 input, suggesting that endogenous Mov10 was not required for viral infectivity. Overall, these results show that Mov10 can potently inhibit HIV-1 replication at multiple stages.


Figures

FIG. 1.
FIG. 1.
P body protein colocalization with A3G, effects on HIV-1 infectivity, and virion incorporation. (A) A3G colocalizes with P body-associated proteins. HeLa cells were cotransfected with the mRFP-A3G expression plasmid and YFP-Mov10 (I), YFP-DCP1a (II), or YFP-DCP2 (III) expression plasmids. Live cells were visualized at 16 h posttransfection using laser scanning confocal microscopy. Arrows, P bodies; scale bar, 20 μm. (B) Relative infectivity of viruses produced in the presence of F-A3G, F-Mov10, F-DCP1a, or F-DCP2. 293T cells were cotransfected with pHDV-EGFP (3.33 μg), pC-HelpΔVif (2.5 μg), pHCMV-G (0.67 μg), and different amounts (0 to 0.67 μg) of Flag-tagged P body protein expression plasmids. Culture supernatants containing 5 ng of p24 CA were used to infect TZM-bl indicator cells, and luciferase activity was determined. The average infectivities are shown relative to the empty vector control (set to 100%). Error bars represent the standard errors from two independent experiments. (C) Virion incorporation of P body-associated proteins. Total cell lysates and concentrated virus preparations containing 30 ng of p24 CA were analyzed by Western blotting using anti-Flag and anti-p24 CA antibodies. The protein input for cell lysates was normalized using α-tubulin.
FIG. 2.
FIG. 2.
Investigation of mechanisms by which Mov10 inhibits HIV-1 replication. (A) Effect of Mov10 overexpression on infectivity of NL4-3 and HDV-EGFP. 293T cells were cotransfected with pNL4-3 (8 μg) or pHDV-EGFP (8 μg) and pHCMV-G (4 μg) and increasing amounts of F-Mov10 expression plasmid. Serial dilutions of culture supernatants were used to infect TZM-bl cells, and luciferase activity was determined. The labels indicate the ratio of F-Mov10 to HIV-1 DNA used for transfections. The data are plotted as relative infectivities, with the control virus (empty vector) set to 100%. Error bars represent standard errors from four independent experiments. (B) Interactions between Mov10 and A3G do not affect viral infectivity. 293T cells were cotransfected with pHDV-EGFP (3.33 μg) and pHCMV-G (0.67 μg), and increasing amounts (0 to 0.67 μg) of F-A3G expression plasmid were present during virus production in either the absence or presence of 0.67 μg of the F-Mov10 expression plasmid. Culture supernatants containing 5 ng of p24 CA were used to infect TZM-bl cells, and luciferase activity was determined. For viruses with different amounts of F-A3G but no F-Mov10, the data are plotted as relative infectivities, with the control virus (empty vector) set to 100%. For viruses with different amounts of F-A3G and a fixed amount of F-Mov10, the data are plotted as relative infectivities, with the virus having no F-A3G but with F-Mov10 set to 100%. Error bars represent standard errors from two independent experiments. (C) mRFP-Mov10 expression in target cells does not inhibit HIV-1 infection. Plasmids expressing mRFP-tagged P body-associated proteins were transfected into 293T cells; 48 h later, the transfected cells were infected with VSV-G pseudotyped pHDV-EGFP, and the proportions of mRFP and mRFP+ cells that were EGFP+ were determined by FACS analysis. An mRFP expression vector was used as the control (set to 100%). Error bars represent standard errors from three independent experiments. (D) Effect of F-A3G and F-Mov10 on proteolytic processing of HIV-1 Gag. 293T cells were cotransfected with pHDV-EGFP (10 μg) and empty vector, F-A3G (2 μg), or F-Mov10 (4 μg) expression plasmids. Virions were lysed, and the virion proteins (35 or 25 ng of p24 CA) were analyzed by Western blotting using an anti-p24 CA antibody.
FIG. 3.
FIG. 3.
Effect of Mov10 overexpression on virus production, infectivity, intracellular Gag, and Gag processing. (A) Effect of Mov10 overexpression on virus production and infectivity. 293T cells were cotransfected with pHDV-EGFP (10 μg for the F-Mov10/pHDV-EGFP ratios of 0.2, 0.4, and 1, and 5 μg for the ratio of 2), pHCMV-G (2 μg), and increasing amounts (0 to 10 μg) of the F-Mov10 expression plasmid. Culture supernatants were concentrated 40-fold by ultracentrifugation, and the p24 CA levels in the supernatant were determined by ELISA. Serial dilutions of the virus were used to infect TZM-bl indicator cells, and luciferase activity was determined. The data are plotted as the levels of relative p24 CA proteins and relative infectivities, with the control virus (empty vector) set to 100%. (B) Quantitative Western blot analysis of cellular and viral Gag using an anti-p24 CA antibody. Different amounts (5 and 2.5 μg; numbers shown above lanes) of cell lysates were loaded to facilitate protein quantitation. The lanes are labeled as described in the legend to panel A to indicate the ratio of F-Mov10 to pHDV-EGFP DNA used for transfections. The protein input was normalized using α-tubulin. For the virus blotting, different dilutions (1× or 0.5×; numbers shown above lanes) of the concentrated virus were loaded to facilitate protein quantitation. (C) Quantitation of cellular and viral Gag levels with an increasing ratio of F-Mov10 to pHDV-EGFP DNA used for transfections. The integrated signal intensities of the p55 Gag and p24 Gag bands shown in panel B were determined for total cellular Gag (p55) and viral Gag (p55 plus p24) and shown relative to the empty vector control (set to 100%). (D) Effect of F-Mov10 on viral Gag processing. Viral Gag processing was determined by calculating the percentage of p55 of the total Gag (p55 plus p24) using the signal intensities of the Gag bands shown in panel B. These data were then plotted as percentages of the control virus. Error bars represent standard errors from two independent experiments.
FIG. 4.
FIG. 4.
Effect of Mov10 knockdown on HIV-1 RNA and Gag expression, virus production, and virus infectivity. (A) Outline of experimental design. 293T cells were transfected in the absence of any siRNA (TKO reagent only), with a control siRNA, and with a Mov10 siRNA; 48 h later, pHDV-EGFP (1.0 μg) and pHCMV-G (0.2 μg) DNA and siRNAs were cotransfected into the cells in order to produce virus and maintain Mov10 knockdown. Total RNA was extracted from one fraction of the cells 48 h after transfection, and HIV-1 RNA (U5ψ target sequence) was quantified by real-time RT-PCR. Cell proteins from another fraction were analyzed by Western blotting using an anti-p24 CA antibody. The culture supernatants containing 5 ng of p24 CA were used to infect TZM-bl indicator cells, and luciferase activity was determined. (B) Knockdown of endogenous Mov10. Efficiency of Mov10 knockdown was assessed by quantitative Western blot analysis using an anti-Mov10 antibody 48 h after siRNA transfection. The protein input was normalized using α-tubulin. Different amounts (in μg; numbers shown above lanes) were loaded to facilitate protein quantitation, and the integrated signal intensities of the protein bands are shown relative to the control siRNA sample (set to 100%; numbers shown below each lane). (C) The knockdown of Mov10 reduces the steady-state levels of cellular HIV-1 RNA. PBGD RNA was used to normalize for the RNA input. (D) Knockdown of Mov10 decreases the intracellular steady-state levels of HIV-1 Gag. Cell lysates were analyzed by Western blotting using an anti-p24 CA antibody. The protein input was normalized using α-tubulin. (E) Effect of Mov10 knockdown on virus production. The amounts of virion released from cells were quantified by determination of p24 CA using ELISA. (F) Knockdown of Mov10 does not alter virus infectivity. Culture supernatants containing 5 ng of p24 CA were used to infect TZM-bl cells, and luciferase activity was determined. The average results from panels C, E, and F are shown relative to the sample with TKO reagent only (set to 100%). Error bars represent standard errors from four independent experiments. Asterisks indicate statistical significance (t test; P of <0.05).
FIG. 5.
FIG. 5.
Single-virion analyses of YFP-tagged P body protein virion incorporation and quantitation of virus production. (A) Representative images of virus particles labeled with Gag-CeFP and HIV-1 RNA labeled with Bgl-mCherry. No YFP signal was detected in the absence of YFP-tagged protein. In the “merge and shifted” panel, mCherry signal was shifted 6 pixels to the right of the CeFP signal to allow identification of colocalization. One-sixteenth of a representative image is shown. (B) Packaging of YFP-tagged P body-associated proteins into virus particles. All panels are merged and shifted images, where the mCherry and YFP signals were shifted 6 pixels and 12 pixels, respectively, to the right of the CeFP signal. The solid line circle indicates a virus particle containing YFP-A3G, whereas the dashed line circle indicates a virus particle that does not contain YFP-A3G. One-sixteenth of a representative image is shown. (C) Virion incorporation of YFP-tagged P body proteins. Packaging efficiency was calculated by determining the percentage of CeFP+ (Gag) plus mCherry+ (HIV-1 RNA) particles that contained the YFP signal (YFP-tagged proteins). (D) Cellular expression of YFP-tagged proteins. After the virus was collected and filtered for single-virion analysis, the cellular expression of YFP for each sample was measured by FACS analysis. The mean fluorescence intensity of the YFP-A3G (1-μg) sample was set to 100%. (E) Mov10 and A3G decrease virus production. The average particles (CeFP signal) per field were used as a measurement of virus production; the empty control vector was set to 100%. (F) Effect of serial 2-fold dilution of virus on quantitation of CeFP+ particles per field. Average result for three virus samples is shown. (G) Effect of P body proteins on efficiency of viral RNA packaging. RNA packaging efficiency was calculated by determining the percentage of CeFP+ particles that displayed the mCherry signal. (H) Virion incorporation of YFP-tagged P body proteins in the absence of HIV-1 RNA. Packaging efficiency was calculated by determining the percentage of mCherry+ (Gag) particles that contained the YFP signal (YFP-tagged proteins). The numbers shown above each sample name indicate the amount (in μg) of transfected DNA. (C, D, E, and G) Error bars represent standard errors from two independent experiments.
FIG. 6.
FIG. 6.
Mov10 decreases steady-state levels of intracellular HIV-1 Gag and EGFP but not α-tubulin. (A) 293T cells were cotransfected with an HIV-1 Gag expression vector (pGag-BglSL; 0.5 μg), an EGFP expression vector (pEGFP-N1; 0.025 μg) and empty vector (1.0 μg), YFP-Mov10 (1.0 μg) or YFP-DCP1a (0.5 μg). Total cell lysates were analyzed at 16 h posttransfection by quantitative Western blot analysis with anti-p24 CA, anti-GFP, and anti-α-tubulin antibodies. Different amounts (20 μg to 2.5 μg; numbers shown above lanes) of the cell lysates were loaded to facilitate protein quantitation. (B) The integrated signal intensities of the p55 Gag, EGFP, and α-tubulin protein bands from the Western blots shown in panel A are shown relative to the empty vector control (20-μg) sample (set to 100%). The number shown above each sample name indicates the amount (in μg) of protein loaded. Error bars represent standard errors from two experiments.
FIG. 7.
FIG. 7.
Association of P body proteins with HIV-1 and 7SL RNA. (A) Immunoprecipitation of cellular RNA-protein complexes using anti-Flag antibody. 293T cells were cotransfected with pHDV-EGFP (7.0 μg) and empty pcDNA3.1 (control), pF-A3G (3.0 μg), pF-Mov10 (18.0 μg), pF-DCP1a (12.0 μg), or pF-DDX6 (12.0 μg). Cell lysates were collected at 48 h posttransfection and were subjected to immunoprecipitation using an anti-Flag antibody. The efficiency of immunoprecipitation was determined by quantitative Western blot analysis using an anti-Flag antibody. Different dilutions of the immunoprecipitates were analyzed to facilitate protein quantitation (numbers shown above lanes). The integrated signal intensities of the protein bands are shown relative to the 0.25× F-A3G sample (set to 100%; numbers shown below each lane); average result from 3 independent experiments is shown. (B) Effect of P body proteins on intracellular steady-state levels of HIV-1 and 7SL RNA. Total cellular RNA was extracted from a fraction of the transfected 293T cells, and the amounts of HIV-1 and 7SL RNAs were quantified using real-time RT-PCR. PBGD RNA was used to adjust for small (<10%) differences in RNA recovery. (C) Quantitation of P body protein-associated HIV-1 and 7SL RNA. Total RNA was isolated from immunoprecipitated cellular RNA-protein complexes obtained with anti-Flag antibody, and the HIV-1 and 7SL RNAs were quantified using real-time RT-PCR. The coimmunoprecipitated (Co-IP) RNA levels were normalized to the cellular RNA levels and the immunoprecipitated protein amount. Error bars represent standard errors from three independent experiments.
FIG. 8.
FIG. 8.
Real-time PCR analysis of the effects of A3G and Mov10 on HIV-1 reverse transcription. (A) The effects of F-A3G (2 μg DNA) and F-Mov10 (4 μg) on pHDV-EGFP infectivity were determined by flow cytometry. HDV-EGFP produced in the absence of A3G or Mov10 yielded 10 to 12.4% GFP+ cells (set to 100%). (B) Quantitation of early reverse transcription products using an RU5 primer-probe set. (C) Quantitation of minus-strand transfer products using a U3R primer-probe set. (D) Quantitation of late reverse transcription products using a U5ψ primer-probe set. (B to D) All reverse transcription products were detected at 6 h postinfection; the HDV-EGFP copy numbers in the absence of F-A3G or F-Mov10 ranged from 14,800 to 30,200 and were set to 100%. CCR5 gene copy numbers were determined and used to normalize for the DNA input. Control HDV-EGFP was heat inactivated and used in a parallel infection to determine the background from carryover of transfected DNA (<3%). The schematics show viral RNA (thick line), viral DNA (thin line), and approximate locations of the primer-probe sets (thin arrows and black and white circles). (E) Relative integration determined by comparing the U5ψ product accumulation at 120 h to the U5ψ product accumulation at 6 h. Integration efficiency in the absence of F-A3G or F-Mov10 was set to 100%. Error bars represent standard errors from two independent experiments. Asterisks indicate statistically significant differences from the control (t test; P < 0.05).

Similar articles

Cited by

References

    1. Adachi, A., H. E. Gendelman, S. Koenig, T. Folks, R. Willey, A. Rabson, and M. A. Martin. 1986. Production of acquired immunodeficiency syndrome-associated retrovirus in human and nonhuman cells transfected with an infectious molecular clone. J. Virol. 59:284-291. - PMC - PubMed
    1. Beckham, C. J., and R. Parker. 2008. P bodies, stress granules, and viral life cycles. Cell Host Microbe 3:206-212. - PMC - PubMed
    1. Boussif, O., F. Lezoualc'h, M. A. Zanta, M. D. Mergny, D. Scherman, B. Demeneix, and J. P. Behr. 1995. A versatile vector for gene and oligonucleotide transfer into cells in culture and in vivo: polyethylenimine. Proc. Natl. Acad. Sci. U. S. A. 92:7297-7301. - PMC - PubMed
    1. Brass, A. L., D. M. Dykxhoorn, Y. Benita, N. Yan, A. Engelman, R. J. Xavier, J. Lieberman, and S. J. Elledge. 2008. Identification of host proteins required for HIV infection through a functional genomic screen. Science 319:921-926. - PubMed
    1. Campbell, R. E., O. Tour, A. E. Palmer, P. A. Steinbach, G. S. Baird, D. A. Zacharias, and R. Y. Tsien. 2002. A monomeric red fluorescent protein. Proc. Natl. Acad. Sci. U. S. A. 99:7877-7882. - PMC - PubMed

Publication types

MeSH terms

LinkOut - more resources