. 2010 Oct;84(19):9840-52.
doi: 10.1128/JVI.01093-10. Epub 2010 Jul 28.

Lipids and proteins act in opposing manners to regulate polyomavirus infection

Affiliations

Lipids and proteins act in opposing manners to regulate polyomavirus infection

Mengding Qian et al. J Virol. 2010 Oct.

Abstract

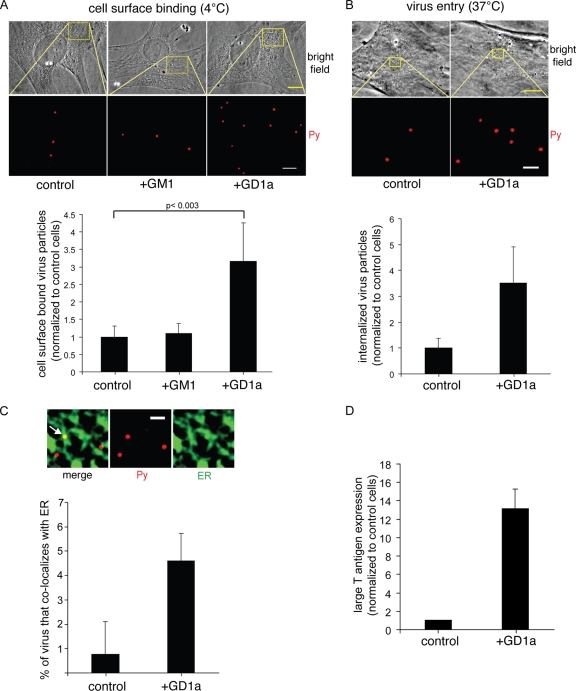
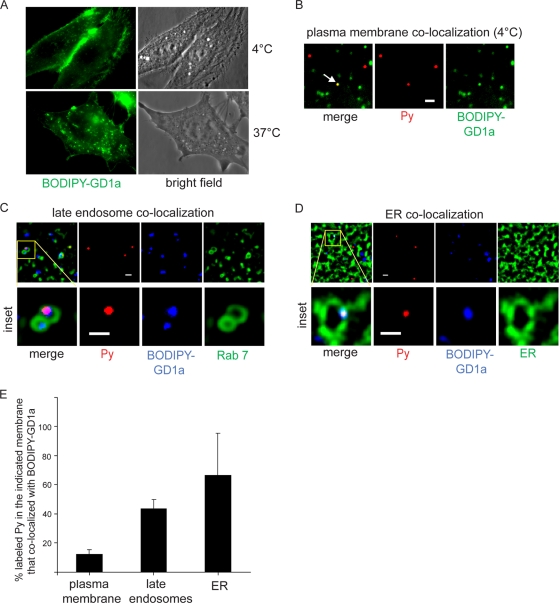
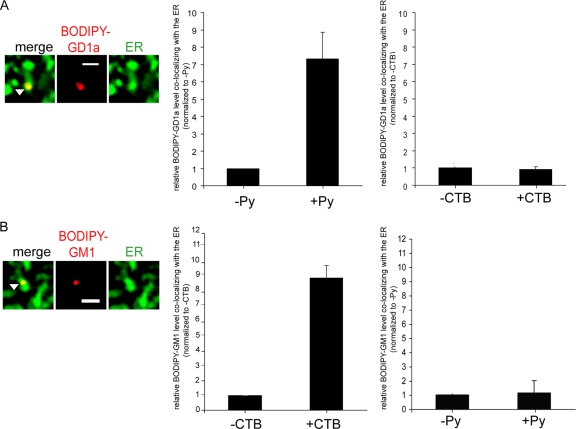
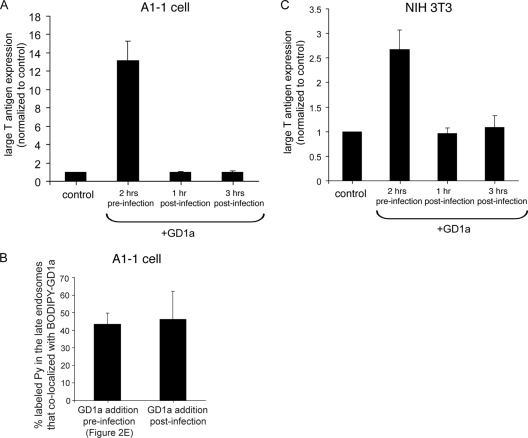
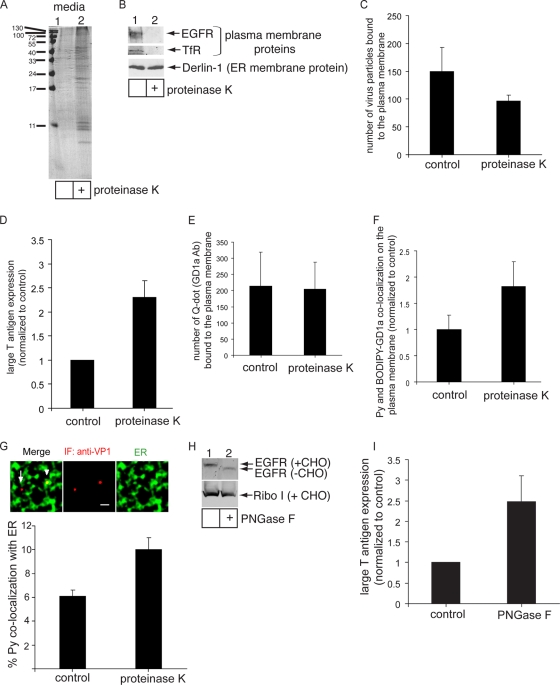
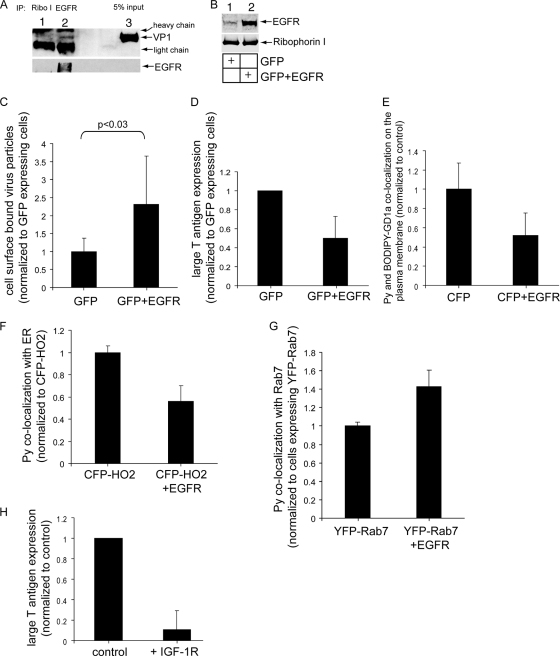
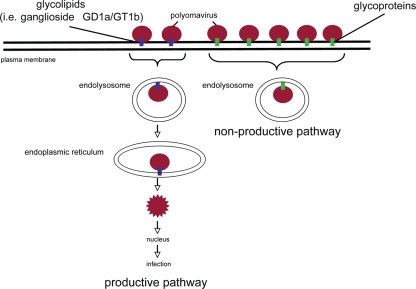
How receptors control virus infection is poorly understood. Polyomavirus (Py) binds to the sialic acid-galactose moiety on receptors to gain entry into host cells and cause infection. We previously demonstrated that the sialic acid-galactose-containing glycolipids called gangliosides GD1a and GT1b promote Py infection, in part, by sorting the virus from the endolysosomes to the endoplasmic reticulum (ER), a critical infection route. Whether these glycolipids act as Py entry receptors, however, is not clear. Additionally, as the majority of glycoproteins also harbor terminal sialic acid-galactose residues, their roles in Py infection are also not well established. Using a ganglioside-deficient cell line, we show that GD1a is the functional entry receptor for Py. GD1a binds to Py on the plasma membrane, and the receptor-virus complex is internalized and transported to the late endosomes and then the ER to initiate infection. In contrast, our findings indicate that glycoproteins act as decoy receptors, restricting the ER transport and infection of Py. Thus, glycolipids and glycoproteins, two major constituents of the plasma membrane, execute opposing functions in regulating infection by a defined virus.


Figures

FIG. 1.
FIG. 1.
GD1a addition to a murine cell line lacking functional receptors stimulates Py binding, entry, ER transport, and infection. (A and B) Control cells, GM1-supplemented cells (shown in panel A alone), and GD1a-supplemented A1-1 cells were incubated with Py at 4°C for 1 h (A) or at 37°C for 4 h (B), washed to remove the unbound virus, and subjected to immunofluorescence with an antibody against VP1. Top panel, representative images. Scale bars, 10 μm for bright-field images and 2 μm (A) or 1 μm (B) for Py images. Bottom panel, quantification of Py binding to the plasma membrane from at least 3 cells. Data represent means ± standard deviations. A two-tailed t test was used. (C) Control and GD1a-supplemented A1-1 cells expressing CFP-HO2 were incubated with Py at 4°C for 40 min, washed to remove the unbound Py, and then incubated at 37°C for 4.5 h. Cells were subjected to immunofluorescence with an antibody against VP1. Top panels, representative images. Arrow, Py that colocalized with the ER. Scale bar, 1 μm. Bottom panel, quantification of the Py colocalizing with the ER from at least 3 cells. Data represent means ± standard deviations. (D) Control and GD1a-supplemented A1-1 cells were incubated with Py at 37°C for 48 h and subjected to immunofluorescence with an antibody against the large T antigen. Data represent means ± standard deviations of the results of at least 2 independent experiments. A total of 3 of 4,004 cells expressed T antigen in the control cells.
FIG. 2.
FIG. 2.
Py colocalizes with GD1a on the plasma membrane, the late endosomes, and the ER. (A) A1-1 cells were incubated with BODIPY-GD1a at 4°C for 20 min (top panels) or at 37°C for 30 min (bottom panels). (B) Cells were incubated first with BODIPY-GD1a at 4°C for 15 min and then with labeled Py at 4°C for 30 min. Arrow, Py that colocalized with BODIPY-GD1a on the plasma membrane. Scale bar, 1 μm. (C) Cells expressing CFP-Rab7 were incubated first with BODIPY-GD1a at 4°C for 15 min and then with labeled Py at 37°C for 3 h. A representative image of Py colocalizing with BODIPY-GD1a in the Rab7-containing vesicle is shown. Scale bars, 1 μm. (D) Cells expressing CFP-HO2 were incubated first with BODIPY-GD1a at 4°C for 15 min and then with labeled Py at 37°C for 4.5 h. A representative image of Py colocalizing with BODIPY-GD1a in the ER is shown. Scale bars, 1 μm. (E) Quantification of the extent of colocalization between labeled Py and BODIPY-GD1a in the indicated membrane from at least 3 cells. Data represent means ± standard deviations.
FIG. 3.
FIG. 3.
Ligand-induced retrograde transport of gangliosides to the ER. (A) A1-1 cells expressing CFP-HO2 were incubated first with BODIPY-GD1a at 4°C for 15 min and were then either incubated with Py at 37°C for 4.5 h or left untreated or incubated with CTB at 37°C for 1 h or left untreated. The picture shown is a representative image of BODIPY-GD1a colocalizing with the ER. Scale bar, 1 μm. Left graph, quantification of the extent of colocalization between BODIPY-GD1a and the ER from at least 3 control or Py-supplemented cells. Right graph, quantification of the extent of colocalization between BODIPY-GD1a and the ER from at least 3 control or CTB-supplemented cells. Data represent means ± standard deviations. (B) NIH 3T3 cells expressing CFP-HO2 were incubated first with BODIPY-GM1 at 4°C for 15 min and then either incubated with CTB at 37°C for 1 h or left untreated or incubated with Py at 37°C for 4.5 h or left untreated. The picture shown is a representative image of BODIPY-GM1 colocalizing with the ER. Scale bar, 1 μm. Left graph, quantification of the extent of colocalization between BODIPY-GM1 and the ER from at least 3 control or CTB-supplemented cells. Right graph, quantification of the extent of colocalization between BODIPY-GM1 and the ER from at least 3 control or Py-supplemented cells. Data represent means ± standard deviations.
FIG. 4.
FIG. 4.
GD1a must be added before, and not after, incubation of cells with Py to stimulate infection. (A) A1-1 cells were treated with 80 μM GD1a at the indicated time points with respect to addition of cells with Py. At 48 h after incubation of cells with Py, cells were subjected to immunofluorescence with an antibody against the large T antigen. Data represent means ± standard deviations of the results of at least 2 independent experiments. A total of 3 of 4,004 control cells expressed T antigen. (B) A1-1 cells expressing CFP-Rab7 were incubated first with BODIPY-GD1a at 4°C for 15 min and then with labeled Py at 37°C for 3 h. GD1a (80 μM) was added pre- or postinfection. The extent of colocalization between labeled Py and BODIPY-GD1a in the CFP-Rab7 late endosomes was quantified from at least 3 cells. Data represent means ± standard deviations. (C) Data are as described for panel A, except NIH 3T3 cells were used. A total of 78 of 1,006 control cells expressed T antigen.
FIG. 5.
FIG. 5.
Removal of plasma membrane glycoproteins stimulates Py infection and ER transport. (A) NIH 3T3 cells were treated with 4 mg of proteinase K/ml at 4°C for 1 h or left untreated. The contents of media from these cells were precipitated and subjected to SDS-PAGE analysis followed by Coomassie staining. (B) Cells were treated with 4 μg of proteinase K/ml at 4°C for 1 h or left untreated. Cell lysates were subjected to SDS-PAGE followed by immunoblotting with antibodies against the EGFR, TfR, and Derlin-1. (C) Quantification of the number of Py particles bound to the plasma membrane in control and proteinase K-treated cells. At least 3 cells in each group were analyzed. Data represent means ± standard deviations. (D) Large T antigen expression in control and proteinase K-treated cells was analyzed as described for Fig. 1D. Data represent the means ± standard deviations of the results from at least 3 independent experiments. A total of 81 of 5,404 control cells expressed large T antigen. (E) Quantification of the number of quantum dots (Q-dot) (GD1a Ab) bound to the cell surface of control and proteinase K-treated cells. (F) Quantification of Py and BODIPY-GD1a colocalization on the plasma membrane of control and proteinase K-treated A1-1 cells. Data were analyzed as described for Fig. 2. (G) Py-ER colocalization in control and proteinase K-treated cells was analyzed by immunofluorescence (IF) staining. Top panel, representative images. Arrowhead, Py that colocalized with the ER. Arrow, Py that did not colocalize with the ER. Scale bar, 1 μm. Bottom panel, quantification of Py colocalizing with the ER from at least 3 cells. Data represent means ± standard deviations. (H) Cells were treated with or without PNGase F at 37°C for 1 h. Cell lysates were subjected to SDS-PAGE followed by immunoblotting with antibodies against the EGFR and Ribo I. (I) Large T antigen expression in control and PNGase F-treated cells was analyzed as described for Fig. 1D. Data represent the means ± standard deviations of the results from at least 2 independent experiments. A total of 27 of 1,232 control cells expressed large T antigen.
FIG. 6.
FIG. 6.
Overexpression of model glycoprotein receptors decreases Py infection. (A) NIH 3T3 cells were incubated with Py at 4°C for 1 h and washed to remove the unbound virus; the resulting cell pellet was incubated with the cross-linker DSP at 4°C for 1 h. Cells were lysed, and the resulting lysate was subjected to immunoprecipitation (IP) using either a control Ribo I- or EGFR-specific antibody. The precipitated sample was subjected to SDS-PAGE followed by immunoblotting with antibodies against Py VP1 and EGFR. (B) Cells were transfected with the control GFP construct or with a combination of GFP and EGFR constructs. Cell lysates were subjected to SDS-PAGE followed by immunoblotting with antibodies against the EGFR and Ribo I. (C) Quantification of the number of Py particles bound to the plasma membrane in cells transfected with the control GFP construct or with a combination of GFP and EGFR constructs. At least 3 cells that expressed GFP in each group were analyzed. Data represent means ± standard deviations. (D) Large T antigen expression in cells transfected with the control GFP construct or with a combination of GFP and EGFR constructs was analyzed as described for Fig. 1D. Only those cells that expressed GFP were counted. Data represent the means ± standard deviations of the results of at least 3 independent experiments. A total of 23 of 342 control cells expressed large T antigen. (E) Quantification of Py and BODIPY-GD1a colocalization on the plasma membrane of A1-1 cells transfected with CFP or with a combination of CFP and EGFR. Only those cells expressing CFP were counted. Data were analyzed as described for Fig. 2. (F) Quantification of the Py-ER colocalization in cells transfected with the control CFP-HO2 construct or with a combination of CFP-HO2 and EGFR constructs. At least 3 cells in each group were analyzed. Data represent means ± standard deviations. (G) Quantification of Py-late endosome colocalization in cells transfected with the control YFP-Rab7 construct or with a combination of YFP-Rab7 and EGFR constructs. At least 3 cells in each group were analyzed. Data represent means ± standard deviations. (H) Large T antigen expression in control NIH 3T3 cells or NIH 3T3 cells stably overexpressing the IGF-1R was analyzed as described for Fig. 1D.
FIG. 7.
FIG. 7.
Lipids and proteins play opposing roles in mediating murine polyomavirus infection. Py that binds to the glycolipid ganglioside receptors is targeted down the infectious route. In this pathway, gangliosides first target Py to the endolysosomes and then sort the virus to the ER, where the virus then penetrates the ER membrane to reach the cytosol. From the cytosol, Py is transported further to the nucleus to initiate infection. In contrast, Py that interacts with glycoproteins such as the EGFR commits to a nonproductive route. After engaging glycoproteins, the virus is taken to endolysosomes and sequestered in this compartment. Because these viruses do not bind to glycolipids, they are not sorted to the ER and consequently do not cause infection.

Similar articles

Cited by

References

    1. Baranowski, E., C. M. Ruiz-Jarabo, and E. Domingo. 2001. Evolution of cell recognition by viruses. Science 292:1102-1105. - PubMed
    1. Bauer, P. H., C. Cui, W. R. Liu, T. Stehle, S. C. Harrison, J. A. DeCaprio, and T. L. Benjamin. 1999. Discrimination between sialic acid-containing receptors and pseudoreceptors regulates polyomavirus spread in the mouse. J. Virol. 73:5826-5832. - PMC - PubMed
    1. Boldyrev, I. A., X. Zhai, M. M. Momsen, H. L. Brockman, R. E. Brown, and J. G. Molotkovsky. 2007. New BODIPY lipid probes for fluorescence studies of membranes. J. Lipid Res. 48:1518-1532. - PMC - PubMed
    1. Campanero-Rhodes, M. A., A. Smith, W. Chai, S. Sonnino, L. Mauri, R. A. Childs, Y. Zhang, H. Ewers, A. Helenius, A. Imberty, and T. Feizi. 2007. N-glycolyl GM1 ganglioside as a receptor for simian virus 40. J. Virol. 81:12846-12858. - PMC - PubMed
    1. Caruso, M., L. Belloni, O. Sthandier, P. Amati, and M. I. Garcia. 2003. Alpha4beta1 integrin acts as a cell receptor for murine polyomavirus at the postattachment level. J. Virol. 77:3913-3921. - PMC - PubMed

Publication types

MeSH terms

LinkOut - more resources