. 2010 Oct;84(19):10329-43.
doi: 10.1128/JVI.00923-10. Epub 2010 Jul 28.

Cellular microRNAs 200b and 429 regulate the Epstein-Barr virus switch between latency and lytic replication

Affiliations

Cellular microRNAs 200b and 429 regulate the Epstein-Barr virus switch between latency and lytic replication

Amy L Ellis-Connell et al. J Virol. 2010 Oct.

Abstract

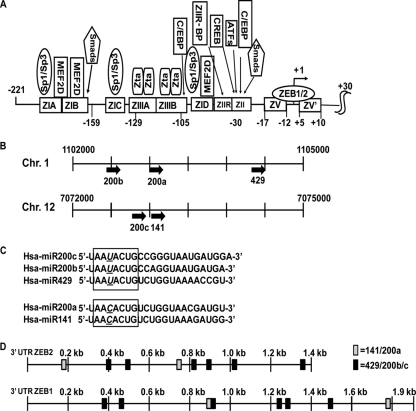
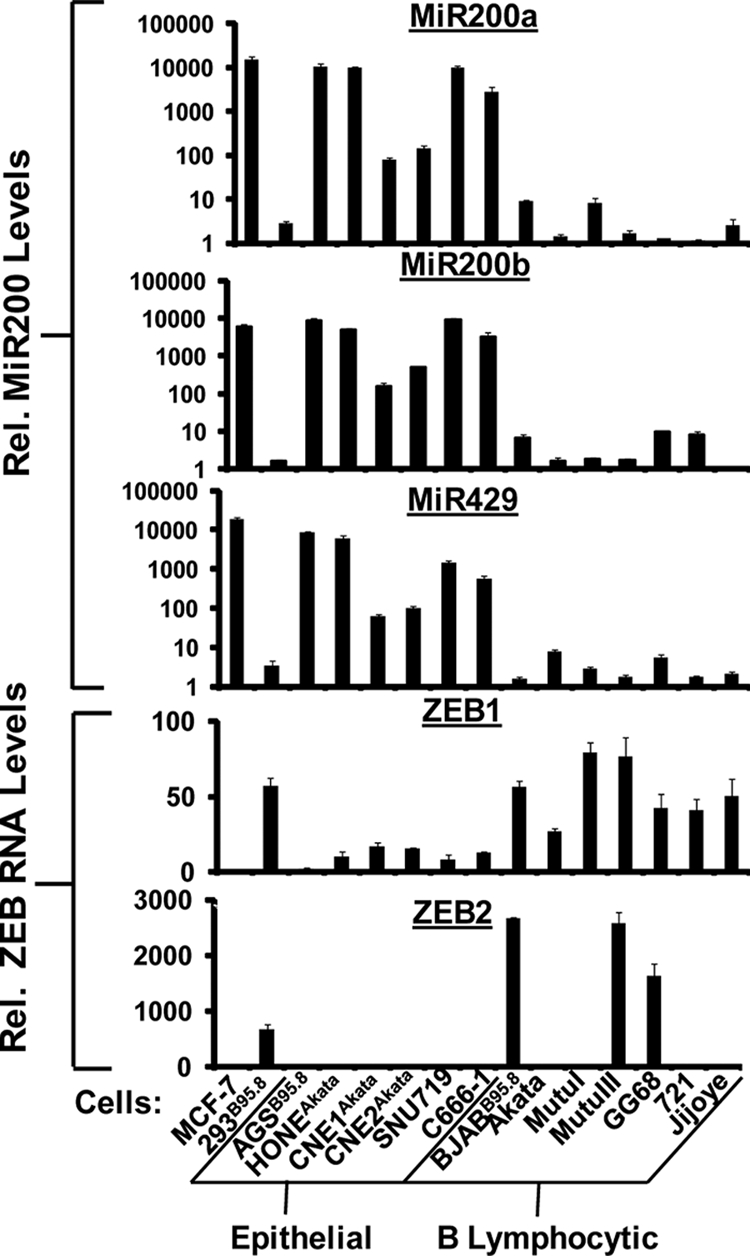
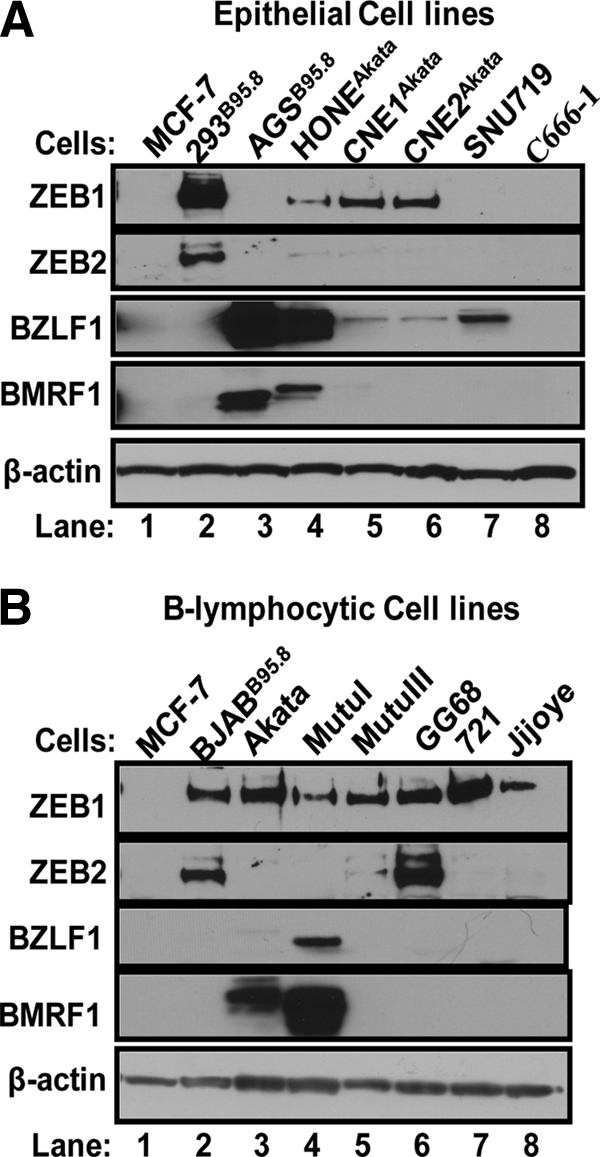
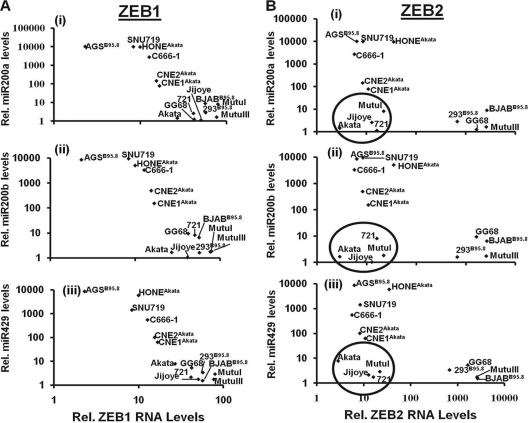
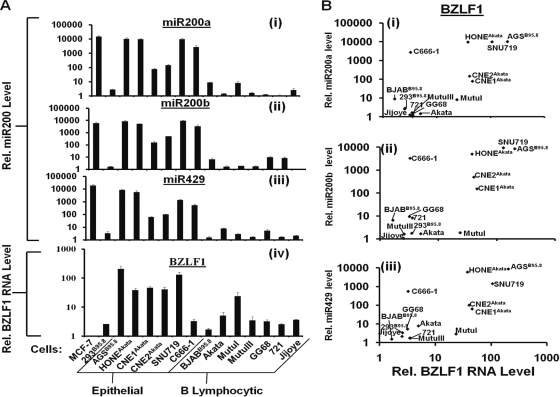
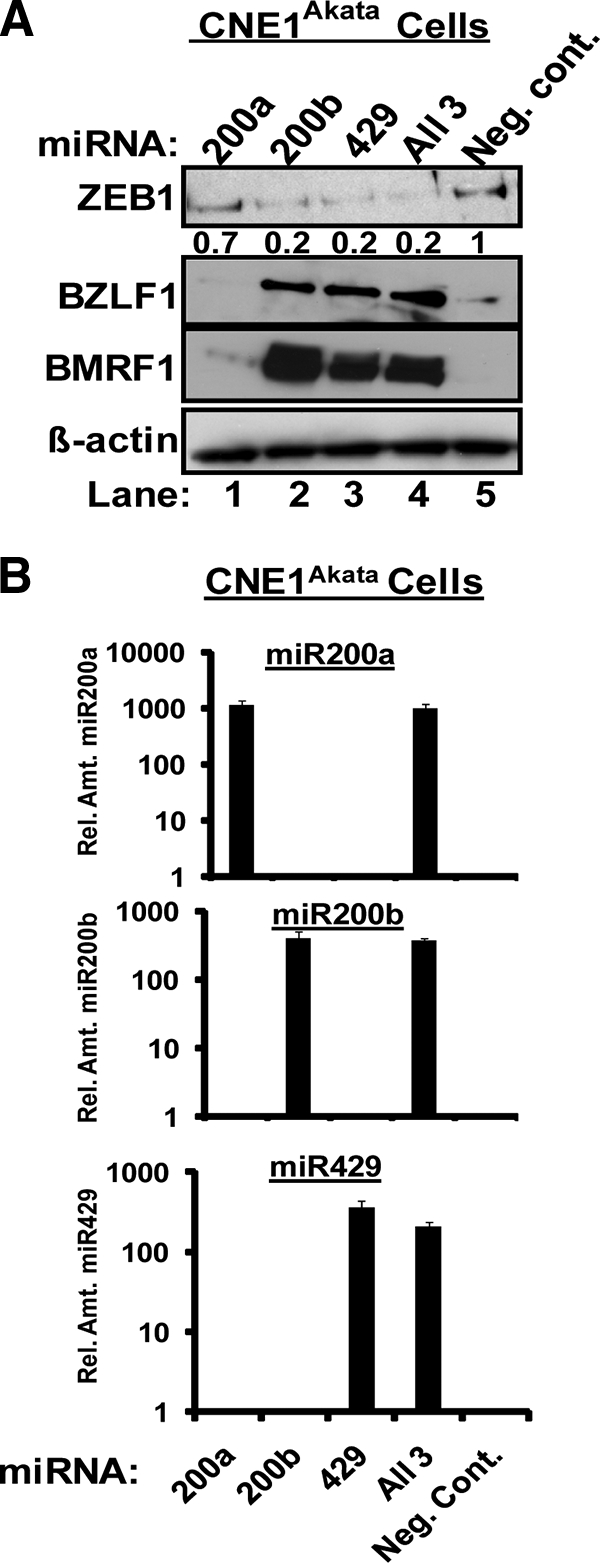
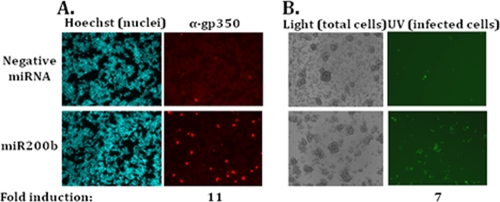
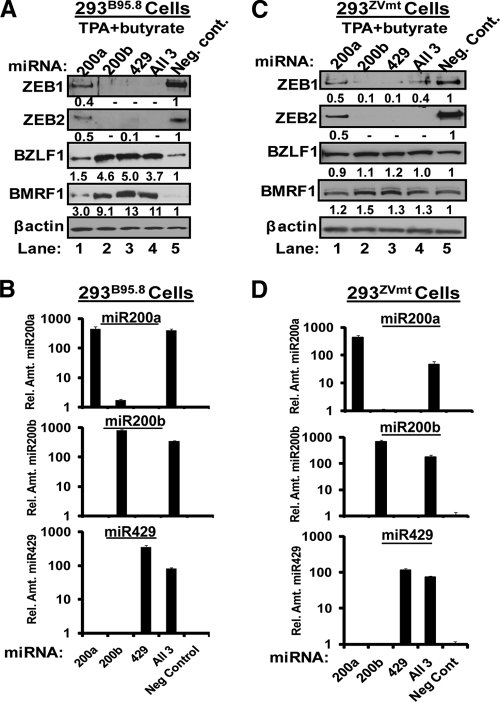
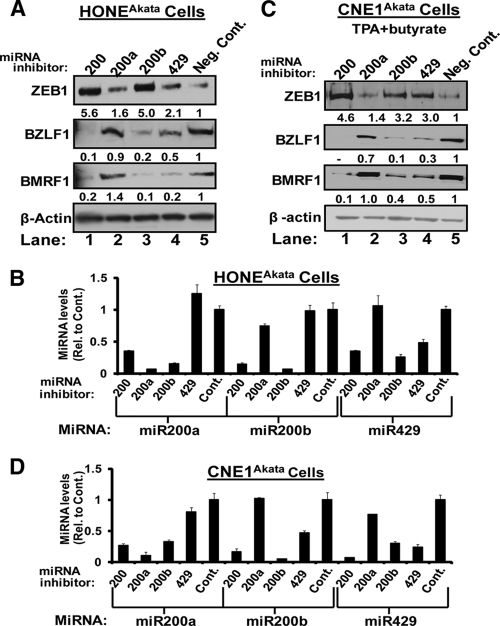
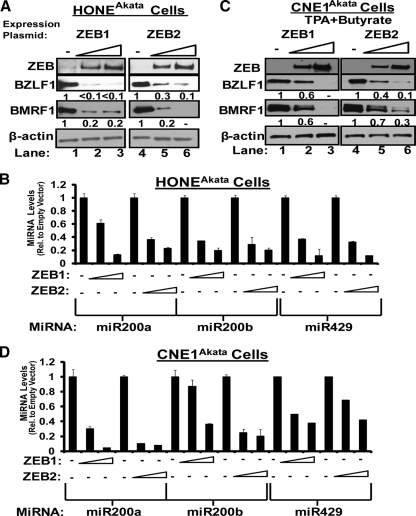
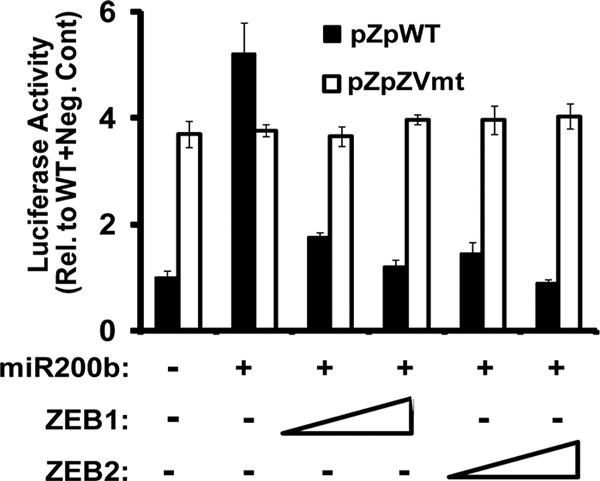
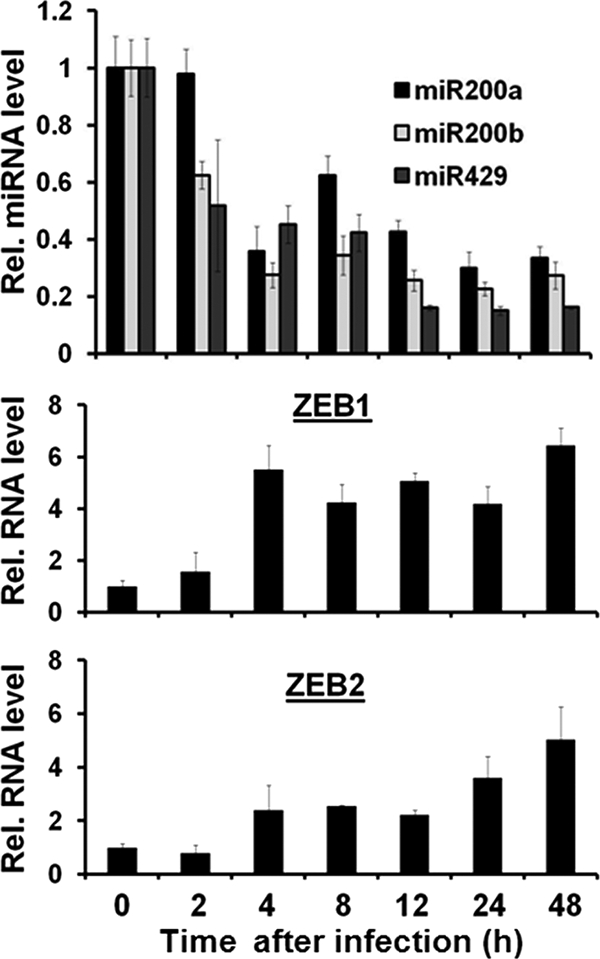
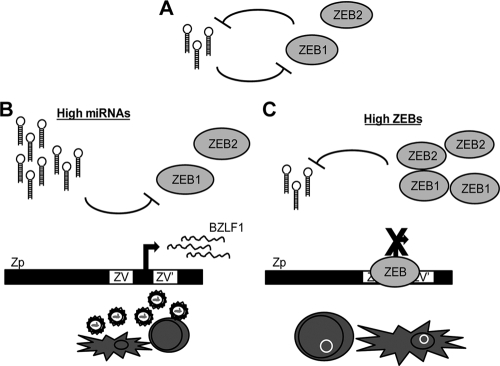
We previously showed that the cellular proteins ZEB1 and ZEB2/SIP1 both play key roles in regulating the latent-lytic switch of Epstein-Barr Virus (EBV) by repressing BZLF1 gene expression. We investigated here the effects of cellular microRNA (miRNA) 200 (miR200) family members on the EBV infection status of cells. We show that miR200b and miR429, but not miR200a, can induce EBV-positive cells into lytic replication by downregulating expression of ZEB1 and ZEB2, leading to production of infectious virus. The levels of miR200 family members in EBV-infected cells strongly negatively correlated with the levels of the ZEBs (e.g., -0.89 [P < 0.001] for miR429 versus ZEB1) and positively correlated with the degree of EBV lytic gene expression (e.g., 0.73 [P < 0.01] for miR429 versus BZLF1). The addition of either miR200b or miR429 to EBV-positive cells led to EBV lytic reactivation in a ZEB-dependent manner; inhibition of these miRNAs led to decreased EBV lytic gene expression. The degree of latent infection by an EBV mutant defective in the primary ZEB-binding site of the EBV BZLF1 promoter was not affected by the addition of these miRNAs. Furthermore, EBV infection of primary blood B cells led to downregulation of these miRNAs and upregulation of ZEB levels. Thus, we conclude that miRNAs 200b and 429 are key regulators via their effects on expression of ZEB1 and ZEB2 of the switch between latent and lytic infection by EBV and, therefore, potential targets for development of new lytic induction therapeutics with which to treat patients with EBV-associated malignancies.


Figures

FIG. 1.
FIG. 1.
miR200 family. (A) Schematic diagram of the promoter region of the EBV BZLF1 gene indicating known cis-acting elements and their trans-acting factors. (B) Schematic diagram of the miRBase-predicted locations of hsa-miR200a, hsa-miR200b, and hsa-miR429 on chromosome 1 and hsa-miR200c and hsa-miR141 on chromosome 12. (C) Sequences of miRNA200 family members. The miRBase program (50, 51) was used to generate the sequences of the five human miRNA-200 family members, hsa-miR200a, hsa-miR200b, hsa-miR200c, hsa-miR429, and hsa-miR141. Seed sequences for each miRNA are highlighted in the boxed area; polymorphisms in the sequences are underlined. (D) TargetScan (50, 51)-predicted binding sites for miR200 family members in the 3′-UTR regions of ZEB2 and ZEB1 mRNAs. Binding sites for hsa-miR200b, hsa-miR200c, and hsa-miR429 are indicated by black rectangles; binding sites for hsa-miR200a and hsa-miR141 are indicated by gray rectangles.
FIG. 2.
FIG. 2.
Correlations between levels of miR200 family members and ZEB1 and ZEB2 RNA. (A) RT-qPCR analysis of levels of miR200a, miR200b, miR429, ZEB1, and ZEB2 RNA in multiple EBV-positive epithelial and B-lymphocytic cell lines and MCF-7 cells. Total RNA was harvested from each indicated cell line, cDNA was synthesized, and the samples were analyzed for relative (Rel.) levels of ZEB1, ZEB2, and the miRNAs 200a, 200b, and 429 as described in Materials and Methods. ZEB1 and ZEB2 RNA levels were normalized to the ribosomal Po level, and miRNA levels were normalized to the RNU38B level present in the same samples.
FIG. 3.
FIG. 3.
Immunoblots showing relative levels of ZEB1 and ZEB2 protein and the EBV IE BZLF1 and E BMRF1 proteins present in EBV-positive epithelial (A) and B-lymphocytic (B) cell lines. Thirty μg of whole-cell protein was loaded per lane and analyzed for relative levels of ZEB1, ZEB2, BZLF1, and BMRF1 protein as described in Materials and Methods. β-Actin served as a loading control.
FIG. 4.
FIG. 4.
miR200 family members levels negatively correlate with ZEB1 and ZEB2 levels in EBV-positive cell lines. Scatter plots showing negative correlations between levels of miRNAs 200a (i), 200b (ii), and 429 (iii) and levels of ZEB1 (A) and ZEB2 (B) RNA in EBV-positive cell lines. Data were taken from Fig. 2.
FIG. 5.
FIG. 5.
Correlation between levels of miR200 family members and BZLF1 RNA in EBV-positive cell lines. (A) RT-qPCR analysis of levels of miRNA 200 family members and BZLF1 RNA in multiple EBV-positive epithelial and B-lymphocytic cell lines. Total RNA was harvested, cDNA was synthesized, and samples were analyzed for levels of BZLF1 RNA and miRNA 200a, 200b, and 429 as described in Materials and Methods. BZLF1 RNA levels were normalized to the ribosomal Po level, and miR200 family levels were normalized to the RNU38B level present in the same samples. (B) Scatter plots showing positive correlations between the level of BZLF1 RNA and level of miR200a (i), miR200b (ii), and miR429 (iii) in EBV-positive cell lines. Data were taken from panel A.
FIG. 6.
FIG. 6.
Transfection into CNE1Akata cells of miR200b or miR429 leads to EBV reactivation. (A) Immunoblot showing levels of the indicated proteins following transfection of CNE1Akata cells with the indicated miRNAs. CNE1 cells latently infected with the Akata strain of EBV were transfected with 30 nM miR200a, miR200b, miR429, all three, or a negative-control miRNA. Seventy-two hours later, cells were harvested for whole-cell protein and RNA. Fifty μg of protein was loaded per well, with β-actin serving as a loading control. Relative protein levels, indicated by the numbers below the blots, were determined by densitometry, with internal normalization to β-actin and external normalization to the negative-control (Neg. cont.) sample processed in parallel. (B) Relative levels of miR200a, miR200b, and miR429 present in the cells from panel A 72 h after transfection. Levels of miR200a, miR200b, and miR429 were determined by RT-qPCR as described in Materials and Methods, with normalization to RNU38B.
FIG. 7.
FIG. 7.
miR200b activates the full EBV lytic cycle in CNE1Akata cells. (A) Indirect immunofluorescence staining showing the addition of miR200b leads to induction of EBV late gene expression. CNE1Akata cells were transfected with 30 nM of the negative control or miR200b and incubated at 37°C for 72 h prior to processing for gp350 protein as described in Materials and Methods. Shown here are fields of cells observed for all cellular nuclei (Hoechst staining) versus the subset of them containing gp350 protein. (B) Raji cell assay showing increased production of infectious virus in CNE1Akata cells after the addition of miR200b. Media from cells transfected and incubated as described in panel A were concentrated and used to infect Raji cells as described in Materials and Methods. Shown here are fields of Raji cells observed with visible light (Light) for all cells versus UV light (UV) for the EBV-infected, GFP-positive ones.
FIG. 8.
FIG. 8.
miRNA-mediated EBV reactivation is mediated via the ZEB-binding element of Zp. (A and C) Immunoblots showing levels of the indicated proteins following transfection of 293B95.8-WT and 293B95.8-ZVmt cells with the indicated miRNAs. 293 cells latently infected with a bacmid containing the B95.8 strain of EBV (A) or a variant of this bacmid with a 2-bp substitution mutation in the ZV element of Zp (C), respectively, were transfected with 30 nM concentrations of the indicated miRNAs. Forty-eight hours later, 20 ng/ml TPA and 3 mM sodium butyrate were added to the medium, and incubation was continued for another 48 h. The cells were then harvested for whole-cell protein and RNA. Thirty μg of protein was loaded per well for analysis of ZEB1 and ZEB2, and 10 μg of protein was loaded per well for analysis of BZLF1 and BMRF1. (B and D) Relative levels (Rel. Amt.) of miR200a, miR200b, and miR429 present in the cells from panels A and C, respectively. Levels of miR200a, miR200b, and miR429 were determined by RT-qPCR as described in Materials and Methods, with normalization to RNU38B.
FIG. 9.
FIG. 9.
Inhibition of levels of miR200 family members with modified oligonucleotides reduces EBV lytic gene expression. (A and C) Immunoblots showing levels of the indicated proteins following transfection of HONEAkata (A) and CNE1Akata (C) cells with 60 nM concentrations of the indicated inhibitors of miRNA-200 family members. Seventy-two hours after transfection, 20 ng/ml TPA and 3 mM sodium butyrate were added to the medium containing the CNE1Akata cells, and incubation was continued for an additional 24 h. Whole-cell extracts were prepared for analysis of protein (A and C) and RNA (B and D). Thirty μg of protein was loaded per well for determination of ZEB1 protein levels; 20 μg of protein was loaded per well for determination of BZLF1, BMRF1, and β-actin protein levels. Relative protein levels, shown by the numbers directly below each lane, were calculated by densitometry, with internal normalization to β-actin present in the same samples and external normalization to the protein levels present in the cells processed in parallel that had been transfected with the control miRNA inhibitor. (B and D) Relative levels of miRNAs 200a, 200b, and 429 present in the cells from panels A and C, respectively. Levels of miRNAs 200a, 200b, and 429 were determined by RT-qPCR as described in Materials and Methods, with normalization to RNU38B.
FIG. 10.
FIG. 10.
miR200 family members inhibition via ZEB1 or ZEB2 overexpression decreases EBV lytic gene expression. (A and C) Immunoblots showing relative levels of the indicated proteins in HONEAkata (A) and CNE1Akata (C) cells following transfection with 0, 0.5, or 1.0 μg of an expression plasmid to ZEB1 or ZEB2, as indicated, along with 1.0, 0.5, or 0 μg of their empty vector, pcDNAhismaxC, to apply 1.0 μg total DNA per well in a 6-well plate. Forty-eight hours later, whole-cell extracts were prepared for protein (A and C) and RNA (B and D). The proteins were analyzed for ZEB1, ZEB2, BZLF1, and BMRF1 levels as described in the legend to Fig. 4. (B and D) Relative levels of miRNAs 200a, 200b, and 429 present in the cells from panels A and C, respectively. Levels of miRNAs 200a, 200b, and 429 were determined by RT-qPCR as described in Materials and Methods, with normalization to RNU38B.
FIG. 11.
FIG. 11.
Overexpression of either ZEB1 or ZEB2 inhibits induction of transcription from Zp by miR200b. 293D cells were transfected with 30 nM miR200b or negative-control miRNA (indicated by “-”). Twenty-four hours later, the cells in 12-well plates were cotransfected with a total of 2.0 μg DNA per well consisting of (i) 0.5 μg of the reporter plasmid pZpWT-luc (black bars) or pZpZVmt-luc (white bars), (ii) 0, 0.25, or 0.5 μg of a plasmid expressing ZEB1 or ZEB2, as indicated, along with 1.0, 0.75, or 0.5 μg of their empty vector pcDNAhismaxC, respectively, and (iii) 0.5 μg of pCMXRluc as an internal control. Forty-eight hours later, the cells were harvested. Firefly luciferase activity was determined, with internal normalization to Renilla luciferase and external normalization to the value obtained with the cells transfected in parallel with pZpWT-luc and the negative-control miRNA in the absence of a ZEB expression plasmid. Data shown are from a representative experiment of assays performed in triplicate on three separate occasions.
FIG. 12.
FIG. 12.
EBV infection of primary blood B cells leads to upregulation of ZEB and downregulation of miR200 family member levels. Primary blood B cells (1 × 10⁶ cells/ml) were infected with 1 × 10⁵ GRU/ml of EBV prepared as described in Materials and Methods and incubated at 37°C for the times indicated. Relative miRNA, ZEB1, and ZEB2 RNA levels were determined by RT-qPCR as described in Materials and Methods. Approximately 65% of them scored as GFP positive (i.e., EBV infected) by 48 h after infection. Data were normalized first to RNU38B for miRNAs and ribosomal Po for ZEB RNAs present in the same samples and then to the levels present at time zero.
FIG. 13.
FIG. 13.
Model for roles of ZEBs and miR200 family members in infection by EBV. (A) Schematic representation of the double-negative feedback loop between the ZEBs and the miR200 family members. (B) When these miRNAs are present at high levels, ZEB1 and ZEB2 protein synthesis is inhibited. In EBV-positive cells, this leads to lytic replication. (C) When either ZEB1 or ZEB2 is present at a high level, it inhibits expression of both miR200 family members and the BZLF1 gene, leading to EBV latency.

Similar articles

Cited by

References

    1. Adam, L., M. Zhong, W. Choi, W. Qi, M. Nicoloso, A. Arora, G. Calin, H. Wang, A. Siefker-Radtke, D. McConkey, M. Bar-Eli, and C. Dinney. 2009. miR-200 expression regulates epithelial-to-mesenchymal transition in bladder cancer cells and reverses resistance to epidermal growth factor receptor therapy. Clin. Cancer Res. 15:5060-5072. - PMC - PubMed
    1. Adamson, A. L., and S. Kenney. 2001. Epstein-Barr virus immediate-early protein BZLF1 is SUMO-1 modified and disrupts promyelocytic leukemia bodies. J. Virol. 75:2388-2399. - PMC - PubMed
    1. Altmann, M., and W. Hammerschmidt. 2005. Epstein-Barr virus provides a new paradigm: a requirement for the immediate inhibition of apoptosis. PLoS Biol. 3:e404. - PMC - PubMed
    1. Ambros, V. 2000. Control of developmental timing in Caenorhabditis elegans. Curr. Opin. Genet. Dev. 10:428-433. - PubMed
    1. Bartel, D. P. 2004. MicroRNAs: genomics, biogenesis, mechanism, and function. Cell 116:281-297. - PubMed

Publication types

MeSH terms