. 2010 Jul 28;30(30):10076-85.
doi: 10.1523/JNEUROSCI.6309-09.2010.

Coalescence and fragmentation of cortical networks during focal seizures

Affiliations

Coalescence and fragmentation of cortical networks during focal seizures

Mark A Kramer et al. J Neurosci. .

Abstract

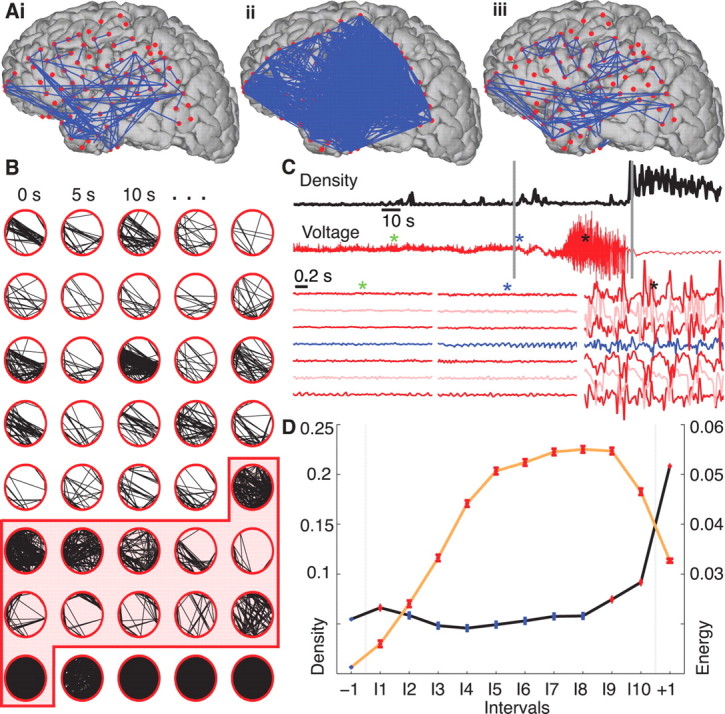
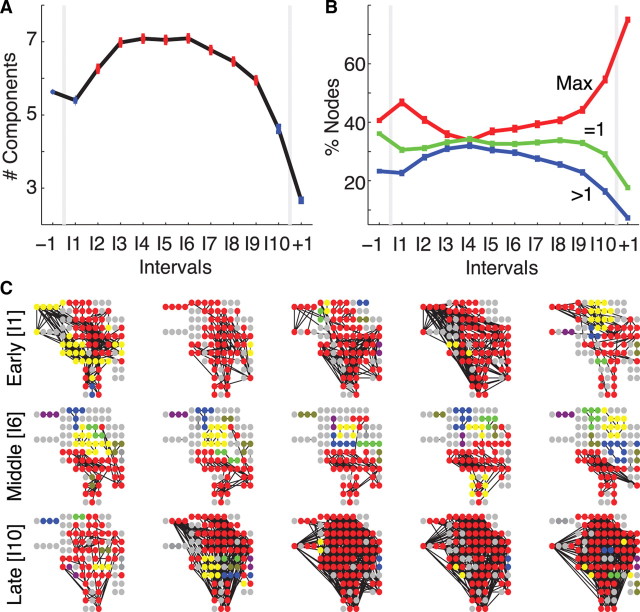
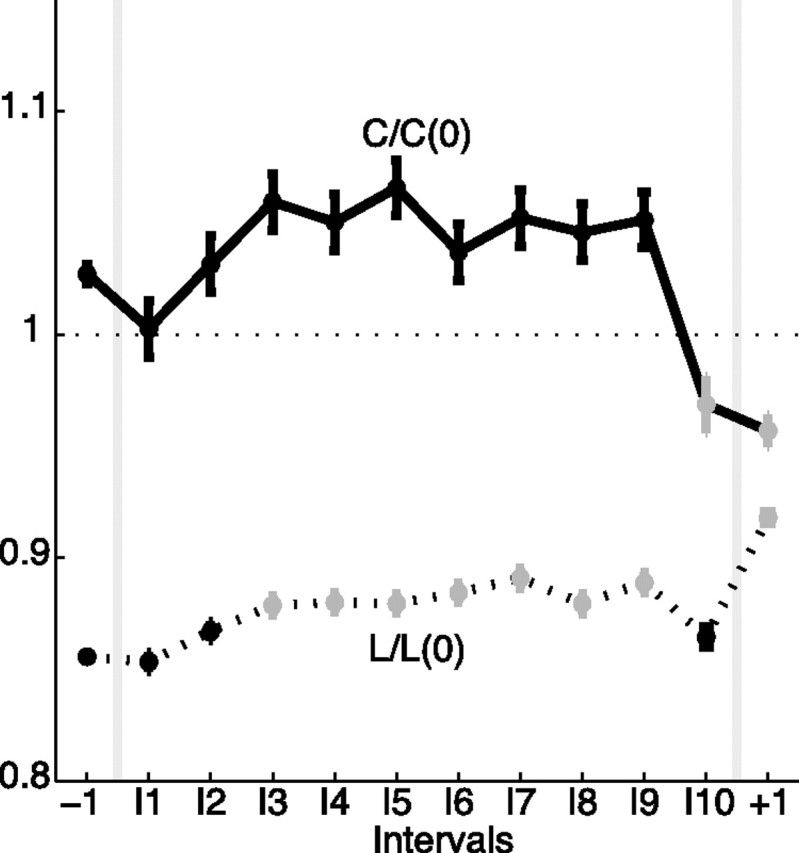
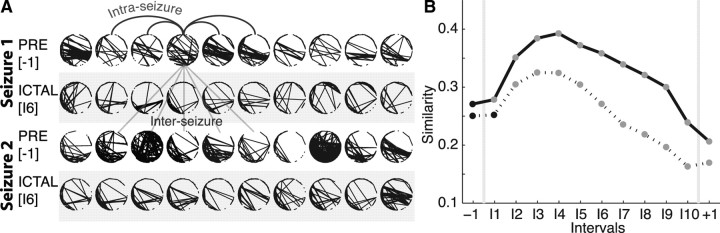
Epileptic seizures reflect a pathological brain state characterized by specific clinical and electrical manifestations. The proposed mechanisms are heterogeneous but united by the supposition that epileptic activity is hypersynchronous across multiple scales, yet principled and quantitative analyses of seizure dynamics across space and throughout the entire ictal period are rare. To more completely explore spatiotemporal interactions during seizures, we examined electrocorticogram data from a population of male and female human patients with epilepsy and from these data constructed dynamic network representations using statistically robust measures. We found that these networks evolved through a distinct topological progression during the seizure. Surprisingly, the overall synchronization changed only weakly, whereas the topology changed dramatically in organization. A large subnetwork dominated the network architecture at seizure onset and preceding termination but, between, fractured into smaller groups. Common network characteristics appeared consistently for a population of subjects, and, for each subject, similar networks appeared from seizure to seizure. These results suggest that, at the macroscopic spatial scale, epilepsy is not so much a manifestation of hypersynchrony but instead of network reorganization.


Figures

Figure 1.
Figure 1.
Network synchronization increases at ictal onset and offset but falls to preictal values during the seizure. A, Representative networks just before the seizure starts (i), at seizure initiation (ii), and in the middle of the seizure (iii) from a single seizure in a single patient. In this example, the electrode locations have been projected onto a reconstruction of this patient's cortical surface. Because some of the electrodes cannot be easily visualized in this two-dimensional representation, the data are displayed as circular networks containing all electrodes as individual nodes. B, The networks progress from left to right, top to bottom, with a 5 s interval between networks. We arrange the electrodes in a circle (without reference to their physical locations) and indicate sufficiently strong coupling between electrode pairs with black lines. The shaded region denotes the ictal interval. Visual inspection of the evolving network topologies suggests increased network density (i.e., more edges) near ictal onset and termination. C, The network density (black) and ECoG data from a single electrode (red, top) for the representative example. At ictal onset and termination, indicated with the vertical gray lines, the network density increases dramatically, whereas during the middle portion of the seizure, the ECoG data exhibits large-amplitude fluctuations. The colored asterisks indicate the location of three 2 s intervals plotted for representative grid and strip electrodes below, including the activity of the presumptive onset electrode as identified by the clinical team (blue trace). D, The density (black curve), averaged across all subjects and seizures and adjusted for differences in subjects, for 12 time intervals: one preictal (−1), 10 ictal (I1, I2, …, I10), and one postictal (+1). In each interval, the circle indicates the mean density (n = 9049 networks preictal, n = 939 networks per ictal interval, and n = 2817 networks postictal) and the vertical lines the SE. Statistically significant increases in density compared with preictal values (see Materials and Methods) are indicated in red and occur at ictal onset (interval I1) and near ictal offset (intervals I9, I10, +1). We also plot the normalized signal energy (orange curve) for each interval averaged across all subjects and seizures (n = 45609 preictal, n = 3614 per ictal interval, and n = 10842 postictal). Unlike the density, the signal energy increases significantly above preictal values for all ictal and postictal intervals.
Figure 2.
Figure 2.
The largest network components fracture during the seizure. A, The average number of connected components (adjusted for differences in subjects) increases during the course of a seizure; points plotted in red indicate a statistically significant increase from the preictal value (number of networks per interval same as in Fig. 1; see Materials and Methods). B, The average percentage of nodes in the largest connected component (red, Max), in trivial components (green, =1), and in other connected components (blue, >1) for the population of subjects and adjusted for differences in subjects. After ictal onset, nodes leave the largest component and become isolated or join other connected components. C, Examples of connected components during early ictal (top row), middle ictal (middle row), and late ictal (bottom row) intervals for a single subject and seizure. Each circle indicates an electrode (including both those on the cortical surface or subcortical) oriented to match surgical placement, and each black line indicates an edge. The electrode colors signify components: all electrodes of the same color belong to the same component, red denotes the largest component, and gray denotes single (isolated) electrodes. During the middle seizure interval, the largest component shrinks as more nontrivial components appear compared with the early and late ictal intervals.
Figure 3.
Figure 3.
The topological properties of the dominant subnetwork evolve during the seizure. We plot the scaled characteristic path length [L/L(0), dashed curve] and scaled clustering coefficient [C/C(0), solid curve] for each interval (adjusted for differences in subjects and with the same number of networks per interval as in Fig. 1). Values that increase or decrease significantly from the preictal level are indicated in gray. For all intervals considered, the networks are approximately small-world. During the seizure, both measures tend to increase and the networks therefore become more regular. Just before seizure termination (interval I10), both measures decrease and the networks acquire a more random configuration.
Figure 4.
Figure 4.
Networks become more similar during, and between, seizures. A, Two examples of networks from a preictal interval (unshaded) and ictal interval (shaded) from two different seizures of a single subject. Visual inspection suggests that the ictal networks are more similar both within each seizure (i.e., within each shaded region) and between the two seizures (i.e., between the 2 shaded regions) compared with the preictal networks. The arched (straight) lines indicate example intra-seizure (inter-seizure) comparisons. B, The similarity between networks within each interval of the same seizure (i.e., intra-seizure similarity, solid curve) and between intervals of different seizures from the same subject (i.e., the inter-seizure similarity, dashed curve). The intra-seizure similarity increases during seizure; networks become more similar within ictal intervals compared with preictal intervals. The inter-seizure similarity, which compares networks from the same interval but different seizures of a subject, also increases during seizure. For both curves, circles denote the mean value (n = {82059, 10222, 30666}) of intra-seizure comparisons for the preictal, ictal, and postictal intervals, respectively, and n = {277537, 40169, and 120507} inter-seizure comparisons for the preictal, ictal, and postictal intervals, respectively, adjusted for differences in subjects; the vertical lines denoting the SE are no larger than the black or gray circles. Statistically significant changes from the preictal value are indicated in gray (see Materials and Methods).

References

    1. Alarcon G, Binnie CD, Elwes RD, Polkey CE. Power spectrum and intracranial EEG patterns at seizure onset in partial epilepsy. Electroencephalogr Clin Neurophysiol. 1995;94:326–337. - PubMed
    1. Allen PJ, Fish DR, Smith SJ. Very high-frequency rhythmic activity during SEEG suppression in frontal lobe epilepsy. Electroencephalogr Clin Neurophysiol. 1992;82:155–159. - PubMed
    1. Ansari-Asl K, Senhadji L, Bellanger JJ, Wendling F. Quantitative evaluation of linear and nonlinear methods characterizing interdependencies between brain signals. Phys Rev E Stat Nonlin Soft Matter Phys. 2006;74 031916. - PMC - PubMed
    1. Arthuis M, Valton L, Régis J, Chauvel P, Wendling F, Naccache L, Bernard C, Bartolomei F. Impaired consciousness during temporal lobe seizures is related to increased long-distance cortical-subcortical synchronization. Brain. 2009;132:2091–2101. - PubMed
    1. Bartolomei F, Wendling F, Vignal JP, Kochen S, Bellanger JJ, Badier JM, Le Bouquin-Jeannes R, Chauvel P. Seizures of temporal lobe epilepsy: identification of subtypes by coherence analysis using stereo-electro-encephalography. Clin Neurophysiol. 1999;110:1741–1754. - PubMed

Publication types

LinkOut - more resources