. 2010 Jul 28;30(30):10220-32.
doi: 10.1523/JNEUROSCI.1385-10.2010.

SIRT1 promotes the central adaptive response to diet restriction through activation of the dorsomedial and lateral nuclei of the hypothalamus

Affiliations

SIRT1 promotes the central adaptive response to diet restriction through activation of the dorsomedial and lateral nuclei of the hypothalamus

Akiko Satoh et al. J Neurosci. .

Abstract

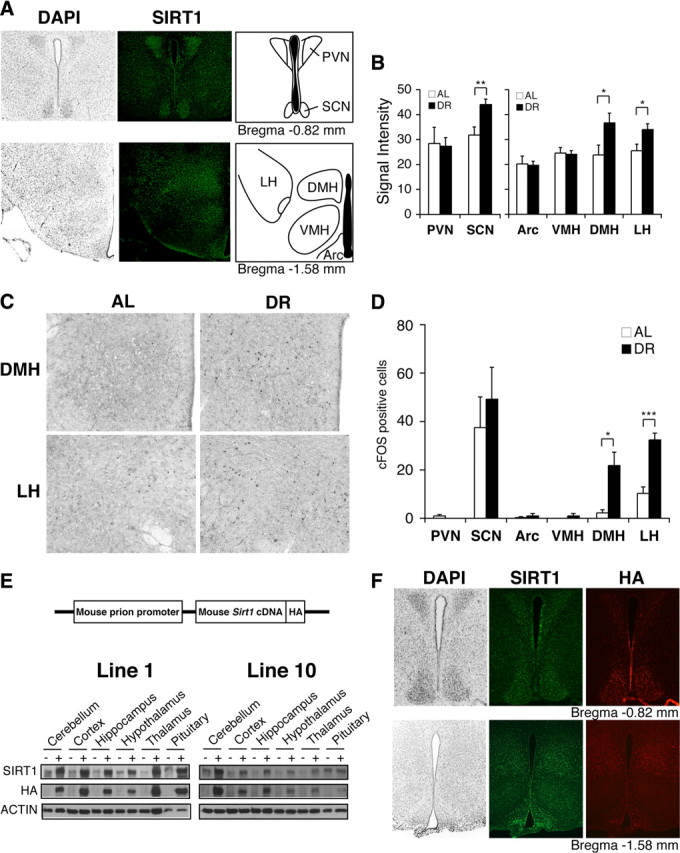
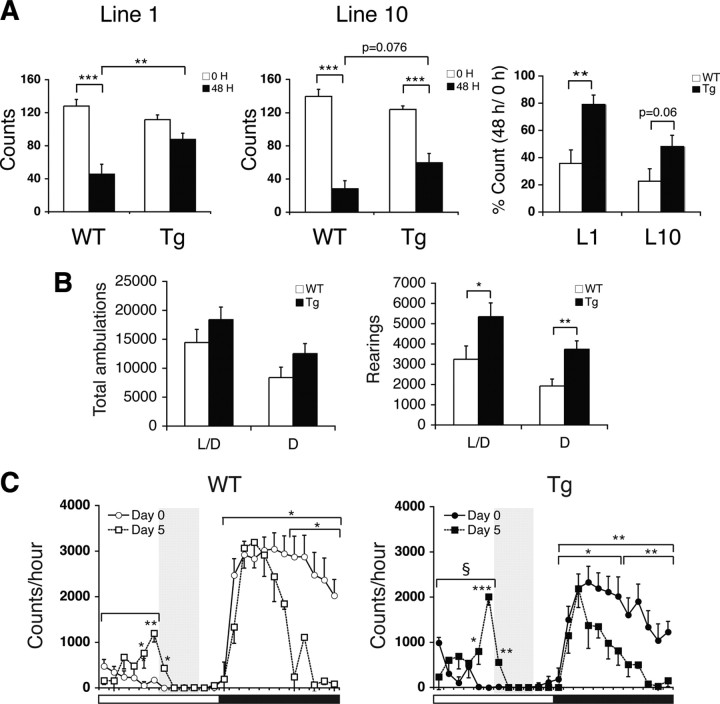
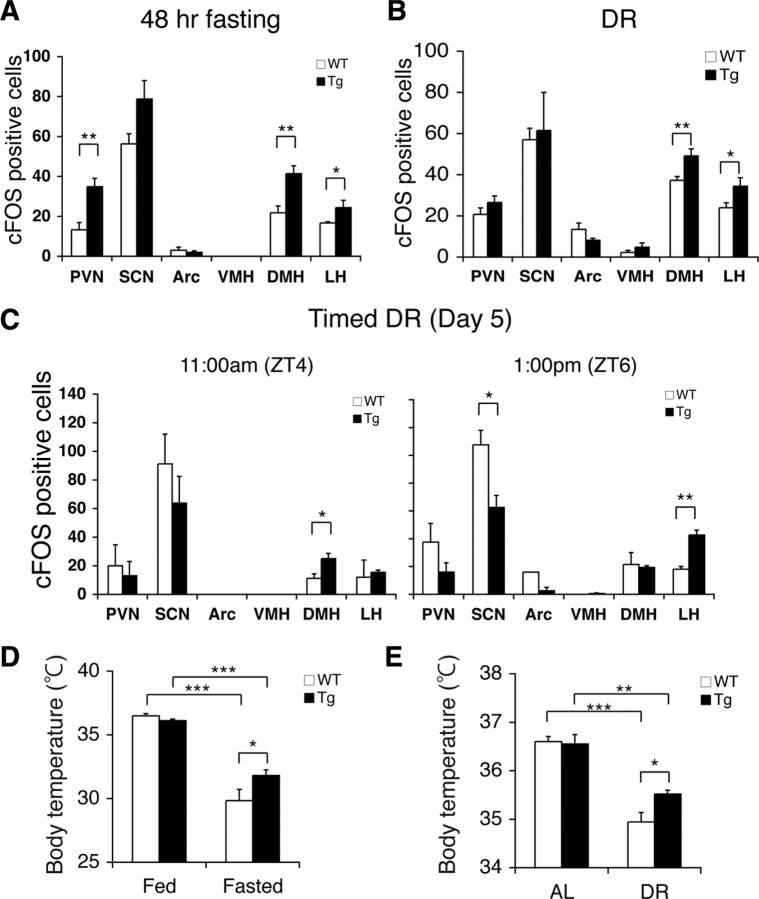
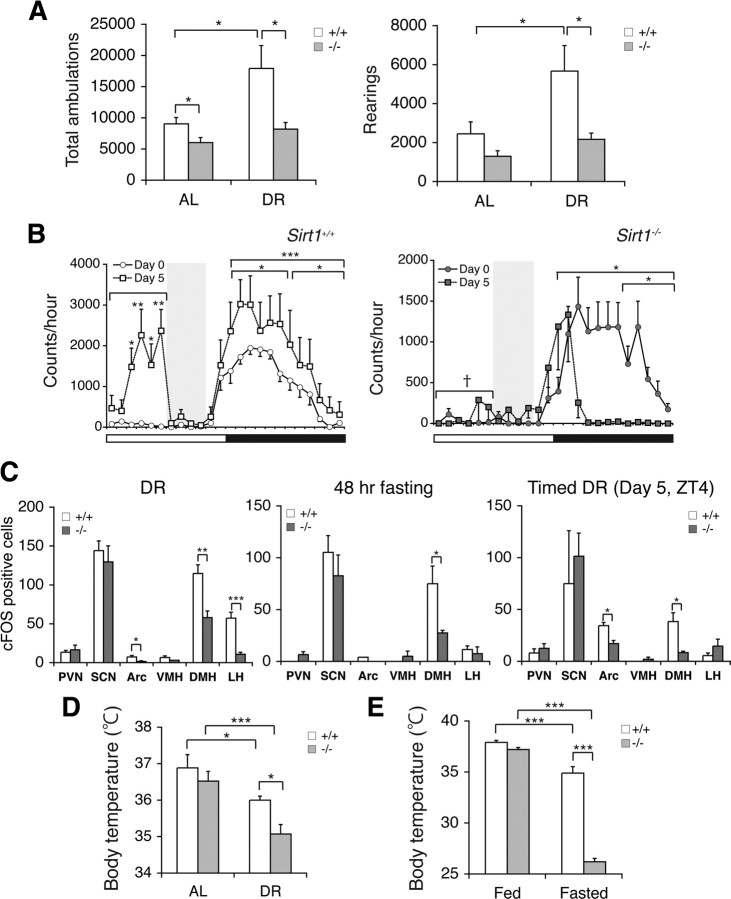
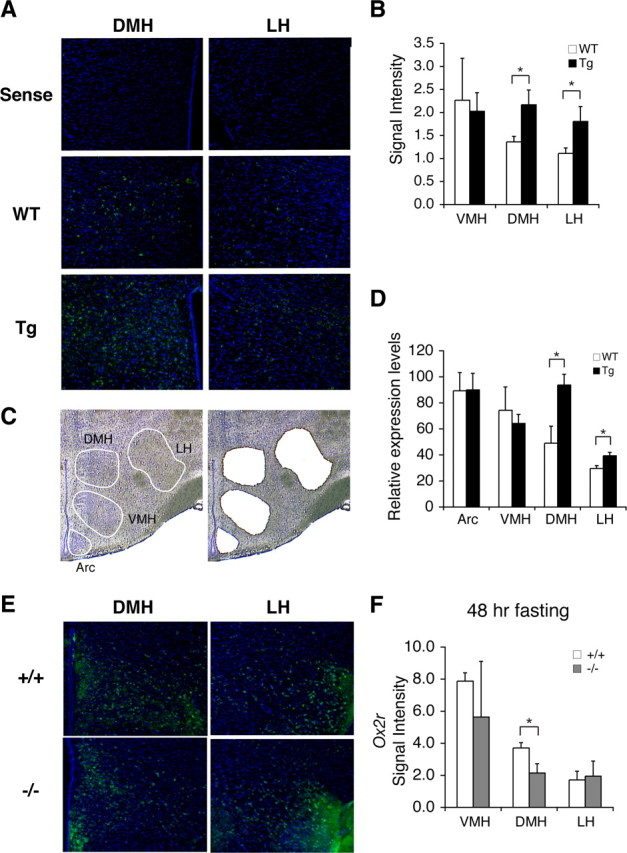
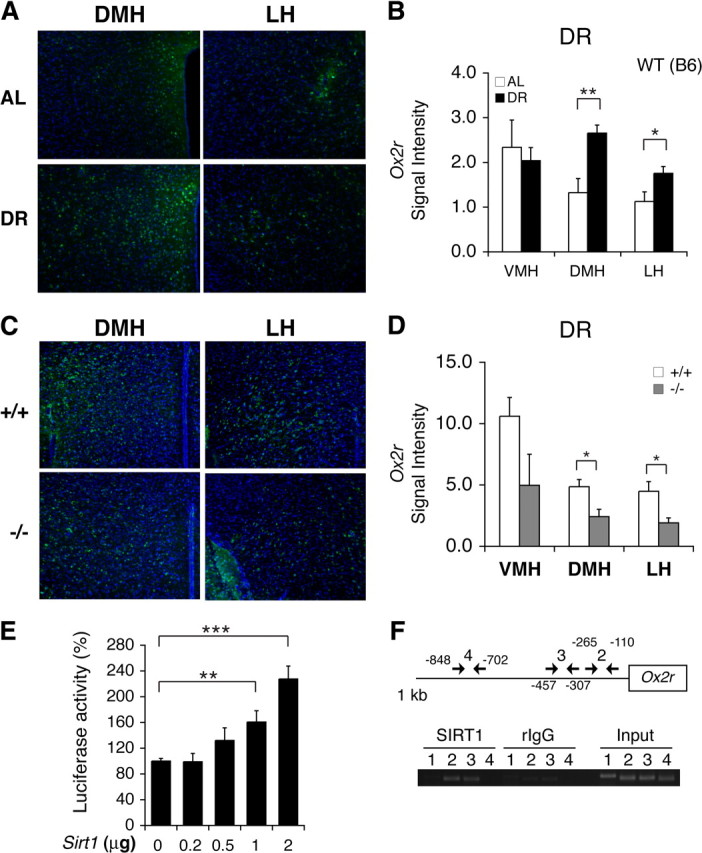
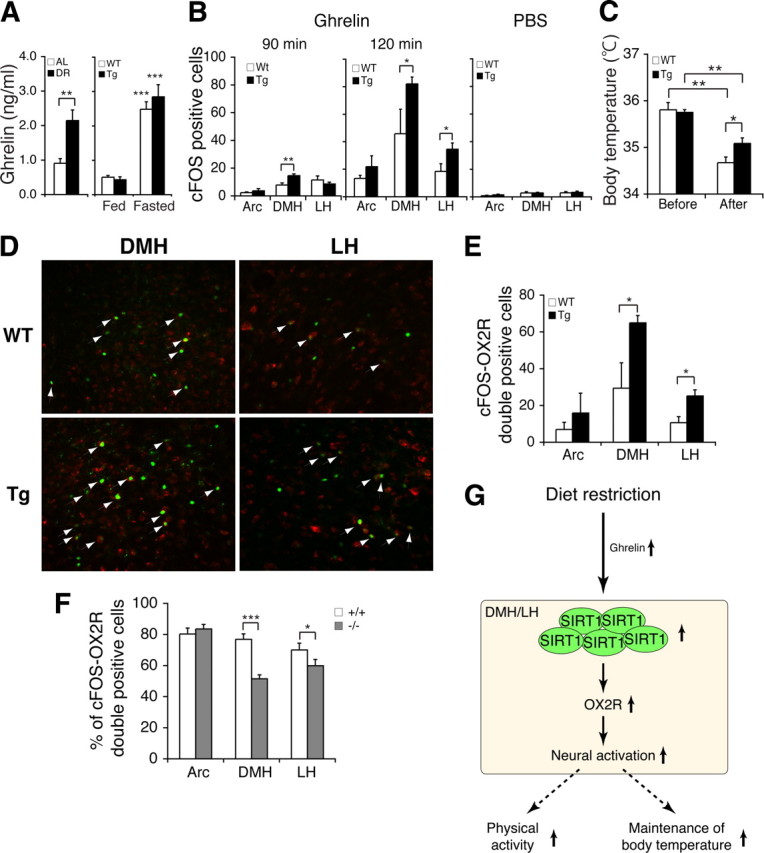
Diet restriction retards aging and extends lifespan by triggering adaptive mechanisms that alter behavioral, physiological, and biochemical responses in mammals. Little is known about the molecular pathways evoking the corresponding central response. One factor that mediates the effects of diet restriction is the mammalian nicotinamide adenine dinucleotide (NAD)-dependent deacetylase SIRT1. Here we demonstrate that diet restriction significantly increases SIRT1 protein levels and induces neural activation in the dorsomedial and lateral hypothalamic nuclei. Increasing SIRT1 in the brain of transgenic (BRASTO) mice enhances neural activity specifically in these hypothalamic nuclei, maintains a higher range of body temperature, and promotes physical activity in response to different diet-restricting paradigms. These responses are all abrogated in Sirt1-deficient mice. SIRT1 upregulates expression of the orexin type 2 receptor specifically in these hypothalamic nuclei in response to diet-restricting conditions, augmenting response to ghrelin, a gut hormone whose levels increase in these conditions. Our results suggest that in the hypothalamus, SIRT1 functions as a key mediator of the central response to low nutritional availability, providing insight into the role of the hypothalamus in the regulation of metabolism and aging in mammals.


Figures

Figure 1.
Figure 1.
SIRT1 is expressed in major hypothalamic nuclei, and both SIRT1 levels and the number of activated neurons increase in the DMH and LH in diet-restricted hypothalami. A, Immunofluorescent staining of SIRT1 (green) in major hypothalamic nuclei, including the PVN, SCN, Arc, VMH, DMH, and LH. Nuclei are counterstained by DAPI (gray). B, Signal intensities of SIRT1 staining in hypothalami after 14 d DR compared to AL (*p < 0.05, **p < 0.01, n = 4 mice, 4–8 sections per hypothalamic nucleus). The signal intensity per area was digitally quantified after subtracting surrounding background. Results are shown as mean values ± SEM. C, D, cFOS staining in the DMH and LH after 14 d DR (C), and quantification of the number of cFOS-positive cells in hypothalamic nuclei (*p < 0.05, ***p < 0.001, n = 4 mice, 4–8 sections per hypothalamic nucleus). The numbers of cFOS-positive cells are shown as mean values ± SEM (D). E, Transgene structure for the production of BRASTO mice (upper panel) and distribution of SIRT1 in major brain regions in both lines 1 and 10 of BRASTO mice (lower panels). F, Immunofluorescent staining of SIRT1 (green) and HA (red) in hypothalami of BRASTO line 10. Nuclei are counterstained by DAPI (gray).
Figure 2.
Figure 2.
BRASTO mice exhibit enhanced physical activity in response to multiple diet-restricting paradigms. A, Physical activity levels of BRASTO female mice after 48 h fasting in line 1 (left) and line 10 (middle). Activity counts (the numbers of quadrants crossed; left and middle) and percentage counts relative to the fed condition (right) are shown as mean values ± SEM (**p < 0.01, ***p < 0.001 by one-way ANOVA with Tukey–Kramer post hoc test, n = 9–12 mice). B, Numbers of total ambulations (left) and rearings (right) of BRASTO (Tg) and control (WT) male mice in line 10 after 14 d DR are shown as mean values ± SEM (*p < 0.05, **p < 0.01, n = 6 mice). L/D, Light plus dark periods; D, dark period alone. C, Wheel-running activity levels of BRASTO male mice in line 10 during a timed DR paradigm. Activity counts per hour through a 24 h light/dark cycle are shown. Shading represents feeding time (ZT6 to 10). Counts at each time point are shown as mean values ± SEM (day 0 vs day 5, *p < 0.05, **p < 0.01, ***p < 0.001 by paired Student's t or Wilcoxon matched-pairs signed-ranks tests; WT vs Tg, §p < 0.05 by a Wilcoxon matched-pairs signed-ranks test; n = 5–10 mice).
Figure 3.
Figure 3.
BRASTO mice show enhanced neural activation in the DMH and LH in response to multiple diet-restricting paradigms. A–C, Quantification of cFOS-positive cells in major hypothalamic nuclei after 48 h fasting (A), 14 d DR (B), and 5 d of timed DR (C) in BRASTO mice in line 10 (*p < 0.05, **p < 0.01, n = 4 for 48 h fasting and DR, 4–8 sections per hypothalamic nucleus; n = 2 at each time point for timed DR, 2–5 sections per hypothalamic nucleus). The numbers of cFOS-positive cells are shown as mean values ± SEM. D, E, Rectal body temperature of BRASTO mice after 48 h fasting (D) and during 14 d DR (E). Levels of rectal body temperature are shown as mean values ± SEM (*p < 0.05, **p < 0.01, ***p < 0.001 by one-way ANOVA with Tukey–Kramer post hoc test, n = 6–7 for 48 h fasting, n = 6 for DR).
Figure 4.
Figure 4.
Sirt1-deficient mice have defects in neurobehavioral adaptation to diet-restricting conditions. A, Numbers of total ambulations (left) and rearings (right) of Sirt1+/+ and Sirt1−/− mice under AL and 14 d DR conditions are shown as mean values ± SEM (*p < 0.05 by one-way ANOVA with Tukey–Kramer post hoc test, n = 5 mice). B, Wheel-running activity levels of Sirt1−/− and Sirt1+/+ mice during a timed DR paradigm. Activity counts per hour of control mice (left) and Sirt1−/− mice (right) through a 24 h light/dark cycle are shown. Shading represents feeding time (ZT6 to 10). Counts at each time point are shown as mean values ± SEM (day 0 vs day 5, *p < 0.05, **p < 0.01, ***p < 0.001 by paired Student's t or Wilcoxon matched-pairs signed-ranks tests; Sirt1+/+ vs Sirt1−/−, p < 0.001 by a Wilcoxon matched-pairs signed-ranks test, n = 9 and 4 for Sirt1+/+ and Sirt1−/− mice, respectively). C, Quantification of the number of cFOS-positive cells in hypothalamic nuclei after 14 d DR (left), 48 h fasting (middle), and 5 d of timed DR (right) in Sirt1−/− mice (*p < 0.05, **p < 0.01, ***p < 0.001, n = 3 mice for DR and fasting, 6–9 sections per hypothalamic nucleus; n = 2 mice for timed DR, 2–7 sections per hypothalamic nucleus). The numbers of cFOS-positive cells are shown as mean values ± SEM. D, E, Rectal body temperature of Sirt1+/+ and Sirt1−/− mice during 14 d DR (D) and after 48 h fasting (E). Levels of rectal body temperature are shown as mean values ± SEM (*p < 0.05, ***p < 0.001 by one-way ANOVA with Tukey–Kramer post hoc test, n = 5–10 for 48 h fasting, n = 5 for DR).
Figure 5.
Figure 5.
SIRT1 upregulates genes that affect neural signaling and activity in the DMH and LH. A, The in situ hybridization of Ox2r (green) in the DMH and LH in BRASTO mice fasted for 48 h. Nuclei were counterstained by DAPI (blue). Upper panel, Sense probe hybridization on wild-type sections; middle and lower panels, antisense probe hybridization on wild-type (WT) and BRASTO (Tg) sections. B, Quantification of signal levels of Ox2r mRNA in the VMH, DMH and LH. Results are shown as mean values ± SEM (*p < 0.05, n = 3–4 mice for each genotype, 3–8 sections per hypothalamic nucleus). C, D, Laser-microdissection of hypothalamic nuclei (C), and Ox2r expression levels in the Arc, VMH, DMH, and LH by real-time qRT-PCR (D). Results are shown as mean values ± SEM (*p < 0.05, n = 4 mice for each genotype). E, F, The in situ hybridization of Ox2r (green) in the DMH and LH in Sirt1+/+ and Sirt1−/− mice fasted for 48 h (E), and signal levels of Ox2r mRNA in the VMH, DMH, and LH are shown as mean values ± SEM (F) (*p < 0.05, n = 2–3 mice for each genotype, 3–6 sections per hypothalamic nucleus).
Figure 6.
Figure 6.
Diet restriction augments Ox2r expression in the DMH and LH via SIRT1. A–D, In situ hybridization of Ox2r in the DMH and LH in wild-type C57BL/6 male mice (A, B) and Sirt1−/− FVB male mice (C, D) under 14 d DR. Ox2r signal levels were quantified in each hypothalamic nucleus under AL and 14 d DR (B) and between diet-restricted Sirt1+/+ and Sirt1−/− mice (D). The signal intensity per area was digitally quantified after subtracting surrounding background. Results are shown as mean values ± SEM (*p < 0.05, **p < 0.01, n = 3–4 each for AL and DR mice (4–10 sections and per hypothalamic nucleus) and for Sirt1+/+ and Sirt1−/− mice (2–8 sections per hypothalamic nucleus)). E, Luciferase activities were measured by transfecting HEK293 cells with a luciferase reporter driven by a ∼1 kb Ox2r promoter and a Sirt1 minigene or a control vector carrying only the Sirt1 promoter. Luciferase activities were compared with increasing amounts of the Sirt1 minigene. The luciferase activities in cells transfected with the promoter-only control vector are normalized to 100%. Results are shown as mean values ± SEM (**p < 0.01, ***p < 0.001 by one-way ANOVA with Tukey–Kramer post hoc test, n = 4). F, Chromatin immunoprecipitation for SIRT1 in the hypothalamus. Fixed chromatin was sonicated and subjected to immunoprecipitation with an anti-SIRT1 polyclonal antibody. Extracted DNA was amplified with each primer set. Primer set 1 was designed for an unrelated genomic region. Locations of primer sets 2–4 are shown in the upper panel. Rabbit IgG (rIgG) was used as a negative control.
Figure 7.
Figure 7.
Ghrelin stimulates OX2R-positive neurons in the BRASTO DMH and LH, but not in Sirt1-deficient mice. A, Serum levels of ghrelin in AL and DR wild-type mice (left) and in fed and fasted BRASTO (Tg) and control (WT) mice (right). Ghrelin levels are shown as mean values ± SEM (**p < 0.01, ***p < 0.001 by one-way ANOVA with Tukey–Kramer post hoc test, n = 5 for each condition). B, The number of cFOS-positive cells in the Arc, DMH, and LH of wild-type (WT) and BRASTO (Tg) mice at 90 min (left) and 120 min (right) after ghrelin injection (30 nmol/kg of body weight) and after PBS injection (right). cFOS-positive cells are shown as mean values ± SEM (*p < 0.05, **p < 0.01 by one-way ANOVA with Tukey–Kramer post hoc test for each hypothalamic nucleus, ghrelin injection, 90 min, n = 2–3 mice for each genotype, 7–12 sections per hypothalamic nucleus; 120 min, n = 3 for each genotype, 3–7 sections per hypothalamic nucleus, PBS injection, n = 2 for each genotype, 6–7 sections per hypothalamic nucleus). C, Rectal body temperature of BRASTO mice 120 min after ghrelin injection. Levels of rectal body temperature are shown as mean values ± SEM (*p < 0.05, **p < 0.01 by one-way ANOVA with Tukey–Kramer post hoc test, n = 6–7). D, Double immunofluorescent staining of cFOS and OX2R in the DMH and LH of wild-type (WT) and BRASTO (Tg) mice at 120 min after ghrelin injection. Arrows indicate cFOS/OX2R-double-positive cells. E, Quantification of the number of cFOS/OX2R-double-positive cells in the Arc, DMH and LH of wild-type (WT) and BRASTO (Tg) mice at 120 min after ghrelin injection. cFOS/OX2R-double-positive cells are shown as mean values ± SEM (*p < 0.05, n = 3 mice for each genotype, 3–7 sections per hypothalamic nucleus). F, Percentage of cFOS/OX2R-double-positive cells compared to a total number of cFOS-positive cells in the Arc, DMH, and LH of Sirt1+/+ and Sirt1−/− mice at 120 min after ghrelin injection. Percentages of cFOS/OX2R-double-positive cells are shown as mean values ± SEM (*p < 0.05, ***p < 0.001, n = 3 mice for each genotype, 6–12 sections per hypothalamic nucleus). G, A model for the SIRT1-mediated neurobehavioral adaptation in the hypothalamus in response to DR. See Discussion for details.

References

    1. Anderson RM, Bitterman KJ, Wood JG, Medvedik O, Sinclair DA. Nicotinamide and PNC1 govern lifespan extension by calorie restriction in Saccharomyces cerevisiae. Nature. 2003;423:181–185. - PMC - PubMed
    1. Aton SJ, Block GD, Tei H, Yamazaki S, Herzog ED. Plasticity of circadian behavior and the suprachiasmatic nucleus following exposure to non-24-hour light cycles. J Biol Rhythms. 2004;19:198–207. - PubMed
    1. Berkefeld H, Sailer CA, Bildl W, Rohde V, Thumfart JO, Eble S, Klugbauer N, Reisinger E, Bischofberger J, Oliver D, Knaus HG, Schulte U, Fakler B. BKCa-Cav channel complexes mediate rapid and localized Ca2+-activated K+ signaling. Science. 2006;314:615–620. - PubMed
    1. Bishop NA, Guarente L. Genetic links between diet and lifespan: shared mechanisms from yeast to humans. Nat Rev Genet. 2007a;8:835–844. - PubMed
    1. Bishop NA, Guarente L. Two neurons mediate diet-restriction-induced longevity in C. elegans. Nature. 2007b;447:545–549. - PubMed

Publication types

MeSH terms