. 2010 Jul 28;30(30):10233-42.
doi: 10.1523/JNEUROSCI.6335-09.2010.

Fast sodium channel gating supports localized and efficient axonal action potential initiation

Affiliations

Fast sodium channel gating supports localized and efficient axonal action potential initiation

Christoph Schmidt-Hieber et al. J Neurosci. .

Abstract

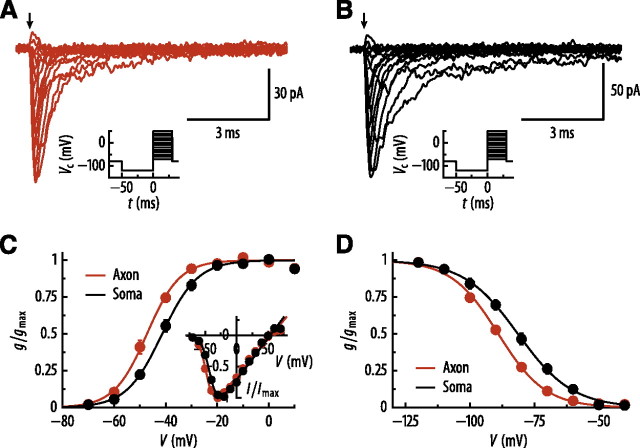
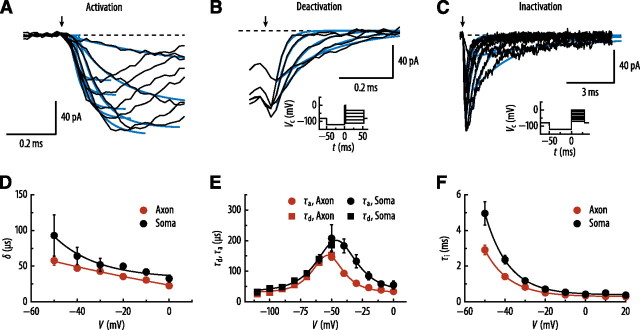
Action potentials (APs) are initiated in the proximal axon of most neurons. In myelinated axons, a 50-times higher sodium channel density in the initial segment compared to the soma may account for this phenomenon. However, little is known about sodium channel density and gating in proximal unmyelinated axons. To study the mechanisms underlying AP initiation in unmyelinated hippocampal mossy fibers of adult mice, we recorded sodium currents in axonal and somatic membrane patches. We demonstrate that sodium channel density in the proximal axon is approximately 5 times higher than in the soma. Furthermore, sodium channel activation and inactivation are approximately 2 times faster. Modeling revealed that the fast activation localized the initiation site to the proximal axon even upon strong synaptic stimulation, while fast inactivation contributed to energy-efficient membrane charging during APs. Thus, sodium channel gating and density in unmyelinated mossy fiber axons appear to be specialized for robust AP initiation and propagation with minimal current flow.


Figures

Figure 1.
Figure 1.
High density of Nav channels in the proximal mossy fiber axon. A, Paired current-clamp recording from a granule cell soma and an axonal bleb showing an AP (upper traces) evoked by brief somatic current injection (lower trace). The AP was always initiated in the axon. Data are from Schmidt-Hieber et al. (2008). The inset shows a scheme of the recording configuration. B, Na+ currents recorded from somatic (black trace) or axonal (red trace) outside-out patches from the same cell. Traces show the average of 20 sweeps. The inset shows the voltage protocol. C, The traces show the difference of capacitive currents before and after pressing the pipette tip against a Sylgard microsphere (top black trace: somatic recording; bottom red trace: axonal recording). Dashed lines indicate leakage current. Gray areas under the curve correspond to the capacitive charge used for membrane surface area calculation. D, The bar graph shows peak Na+ conductance densities in nucleated patches (n = 6), somatic outside-out (oo) patches, and axonal outside-out patches (n = 14). Axonal and somatic outside-out patches are from a paired dataset. E, Plot of peak Na+ conductance density against distance of the axonal bleb from the soma. The black circle represents the average of 14 somatic recordings, whereas the red circles show individual axonal measurements. Na+ conductance density in MFBs (red triangle) was taken from Engel and Jonas (2005). Data points were fitted with a monoexponential function plus a constant (black curve).
Figure 2.
Figure 2.
Axonal Nav channels activate and inactivate at more negative potentials than somatic channels. A, B, Traces show peak activation of Na+ currents recorded from an axonal (A) or a somatic (B) outside-out patch of the same granule cell. The insets show the voltage pulse protocol. The arrows correspond to t = 0 in the voltage pulse protocol. C, D, Peak activation (C) and steady-state inactivation (D) curves. Conductance was normalized to the maximal value and plotted against the test pulse potential. Data were fitted with Equation 2 (C) or 3 (D) (continuous curves). Midpoint potentials of activation (C) were −47.3 mV (slope factor k = 6.4 mV) in the axon (red) and −41.4 mV (k = 6.9 mV) in the soma (black; n = 12). Midpoint potentials of inactivation (D) were −89.0 mV (k = 9.1 mV) in the axon (red) and −81.4 mV (k = 10.5 mV) in the soma (black). The inset in C shows the mean peak current–voltage (I–V) relation for somatic (black) and axonal (red) outside-out patches. The I–V relation was fitted with the product of a linear and a Boltzmann function (Equation 4; continuous curves). Data in C and D are from a paired dataset.
Figure 3.
Figure 3.
Axonal Nav channels activate and inactivate more rapidly than somatic channels. A, Time course of activation onset. The rising phase of the currents were fitted with monoexponential functions with delayed onset. Fit curves (blue) are shown superimposed to the current traces (black). The same voltage pulse protocol as in C (inset) was used. B, Time course of deactivation. For test pulses >−40 mV, monoexponential functions fitted to the late part of the current were subtracted before fitting monoexponential functions to the decay of the tail currents (blue curves; see Materials and Methods). C, Time course of inactivation onset. The decay phase of the currents were fitted with monoexponential functions (blue curves). Insets in B and C show the voltage pulse protocols. The arrows in A–C correspond to t = 0 in the voltage pulse protocol. Dashed lines in A–C are at 0 pA. D–F, Plot of activation delay (D), activation and deactivation time constants (E), and inactivation time constants (F) against test pulse potential (n = 12). Data in D and F were fitted with exponential functions. Data in E were fitted with Equation 5 (see Materials and Methods). Data in D–F are from a paired dataset.
Figure 4.
Figure 4.
Gating kinetics can be reproduced with an eight-state kinetic gating model. A, Gating scheme of the eight-state gating model used for computational analysis of Nav channel gating. B, Simulated Na+ currents using the eight-state gating model. Inset, Voltage pulse protocol. The arrow corresponds to t = 0 in the voltage pulse protocol. C, Peak activation and steady-state inactivation curves. Continuous curves represent the results of the gating models that best fitted the data recorded from axon (red symbols) or soma (black symbols). D–F, Plot of activation delay (D), deactivation and activation time constants (E), and inactivation time constants (F) against test pulse potentials. Curves, Best-fit gating models. Red symbols, Axonal data. Black symbols, Somatic data.
Figure 5.
Figure 5.
Axonal AP initiation in a detailed compartmental model using experimentally determined Na+ conductance densities. A, Plot of measured (black circles) and simulated (continuous curve) peak Na+ conductance density against distance from soma. The inset shows a shape plot of the cell with NEURON. B, Simulation of AP initiation and propagation within a granule cell with NEURON using the best-fit Nav channel gating model as well as experimentally determined Nav channel densities and kinetics. The AP was evoked by a brief current injection into the soma (0.5 ms, 2 nA). Black trace, Somatic AP. Red trace, Axonal AP at a distance of 30 μm from the soma. The dashed line is at −80 mV. C, Bar graphs comparing experimentally determined AP properties (Schmidt-Hieber et al., 2008) to model results. The AP was evoked by brief current injection, as shown in B. The axon of the compartmental model cell was cut at 30 μm distance from the soma and a bleb (2 μm diameter) was connected to the cut end. Left, Maximal rate of rise in the soma. Experiment, 297 ± 12 V · s−1; model, 300 V · s−1. Right, Maximal rate of rise in the axon. Experiment, 485 ± 12 V · s−1; model, 505 V · s−1. D, Plot of axonal AP latencies against distance from soma. The simulated AP was initiated in the axon at a distance of ∼30 μm from the soma. The gray circles show experimentally determined values from 22 granule cells (Schmidt-Hieber et al., 2008).
Figure 6.
Figure 6.
Fast activation kinetics enables AP initiation with relatively low axonal Nav channel density upon strong stimulation. A, Plot of activation time constants against test pulse potentials. The continuous curve represents the eight-state gating model for the proximal axon as shown in Figure 4. The dashed curve represents a gating model developed for neocortical LV pyramidal cell axons (M&S model) (Mainen et al., 1995; Kole et al., 2008). The dotted-dashed curve represents a model of Nav channel gating in MFBs in the distal granule cell axon (E&J model) (Engel and Jonas, 2005). Note that activation time constants are considerably slower in the M&S and E&J models. B, The AP initiation site (axonal distance from soma) was plotted against synaptic conductance (per single synapse of a total of 500) used to evoke the AP in a compartmental model. Positive distances denote axonal AP initiation. Black curve, The eight-state gating model was inserted with nonuniform kinetics and an average Na+ conductance density of 940 pS · μm−2 in the proximal axon. Green curve, The eight-state gating model was inserted with uniform kinetics and an average Na+ conductance density of 940 pS · μm−2 in the proximal axon. Blue continuous curve, The E&J model was inserted with an average Na+ conductance density of 940 pS · μm−2 in the proximal axon. Orange continuous curve, The M&S model was inserted with an average Na+ conductance density of 940 pS · μm−2 in the proximal axon. Orange dashed curve, The M&S model was inserted with an average Na+ conductance density of 2250 pS · μm−2 in the proximal axon. The sharp drops in the curves denote the conductance beyond which the initiation site swaps from an axonal location (positive distance) to a dendritic location (negative distance). When the E&J or M&S models with slower activation kinetics are used, axonal Nav channel density needs to be strongly enhanced to maintain the robustness of the initiation site upon strong synaptic input. By contrast, the combination of fast activation and nonuniform kinetics allows for a relatively low axonal Nav channel density. C, APs were evoked by near-threshold stimulation with excitatory synapses in a compartmental model. In addition, inhibitory synapses were distributed along the proximal 30 μm of the axon to simulate axoaxonic inhibition. Somatic AP amplitude was plotted against conductance per inhibitory synapse. The same color code as in B was used. When the M&S model with a high axonal Na+ conductance density is used, inhibition needs to be 1.7 times stronger to prevent AP generation than in the eight-state model with a low density.
Figure 7.
Figure 7.
Axonal inactivation kinetics is tuned for energy-efficient AP initiation. A–C, APs were evoked by a brief current injection at one end of a very long cylinder (10 mm length, 1 μm diameter). APs (black traces at bottom) and Na+ (red traces) and capacitive (blue traces) currents were measured at the center of the cylinder. Energy efficiency was assessed as the ratio of total Na+ charge transfer and the minimal charge that is required to depolarize the membrane during the AP. A, The experimentally determined inactivation kinetics was used (fh = 1). B, Inactivation kinetics was slowed down by multiplying inactivation rates with the scaling factor fh = 0.5. C, Inactivation kinetics was accelerated by multiplying inactivation rates with fh = 2.0. D, Energy efficiency was plotted against the inactivation rates scaling factor fh (continuous black curve). The experimentally determined kinetics at fh = 1 yielded an energy efficiency of 1.24 (blue horizontal line), close to the minimum of 1.21 (red horizontal line). To assess the impact of Kv channel kinetics, simulations were repeated with slow Kv channel kinetics (activation gating rates multiplied with a factor of 0.5, dotted-dashed curve) and with fast Kv channel kinetics (activation gating rates multiplied with a factor of 1.5, dashed curve), yielding similar results. E, F, Same simulations as in A–C in a thinner cylinder (10 mm length, 0.4 μm diameter) to model the distal axon. A model MFB (4 μm diameter) was placed in the middle of the cylinder. In E, the eight-state model with proximal axonal kinetics was used. In F, the E&J MFB model with faster inactivation kinetics was used. The fast inactivation kinetics was required to obtain a low energy efficiency value during the short time course of the MFB AP.
Figure 8.
Figure 8.
Specialized functional properties of Nav channels in subcellular compartments. The scheme summarizes the heterogeneous distribution of Nav channel density (top), activation kinetics (middle), and inactivation kinetics (bottom) in granule cells. Na+ conductance density, inactivation, and activation time constants were normalized to the somatic values. Midpoint potentials are expressed as the difference with the somatic value. The heat maps on the left summarize the effects of the kinetic properties on excitability and energy efficiency (red, high excitability/good efficiency; blue, low excitability/bad efficiency). Data for the soma and proximal axon (PA) are from this study, and data for the MFB were taken from Engel and Jonas (2005).

Similar articles

Cited by

References

    1. Alle H, Roth A, Geiger JRP. Energy-efficient action potentials in hippocampal mossy fibers. Science. 2009;325:1405–1408. - PubMed
    1. Attwell D, Gibb A. Neuroenergetics and the kinetic design of excitatory synapses. Nat Rev Neurosci. 2005;6:841–849. - PubMed
    1. Attwell D, Laughlin SB. An energy budget for signaling in the grey matter of the brain. J Cereb Blood Flow Metab. 2001;21:1133–1145. - PubMed
    1. Baranauskas G, Martina M. Sodium currents activate without a Hodgkin-and-Huxley-type delay in central mammalian neurons. J Neurosci. 2006;26:671–684. - PMC - PubMed
    1. Bischofberger J, Geiger JRP, Jonas P. Timing and efficacy of Ca2+ channel activation in hippocampal mossy fiber boutons. J Neurosci. 2002;22:10593–10602. - PMC - PubMed

Publication types

LinkOut - more resources