. 2010 Aug 24;107(34):14950-7.
doi: 10.1073/pnas.1005940107. Epub 2010 Jul 28.

Quantitative proteomics of the Cav2 channel nano-environments in the mammalian brain

Affiliations

Quantitative proteomics of the Cav2 channel nano-environments in the mammalian brain

Catrin Swantje Müller et al. Proc Natl Acad Sci U S A. .

Abstract

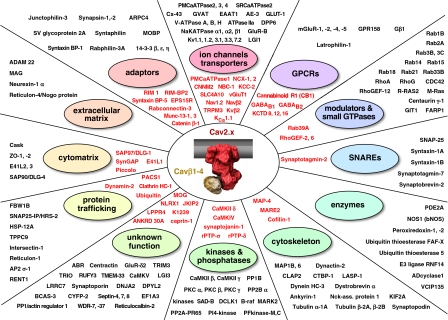
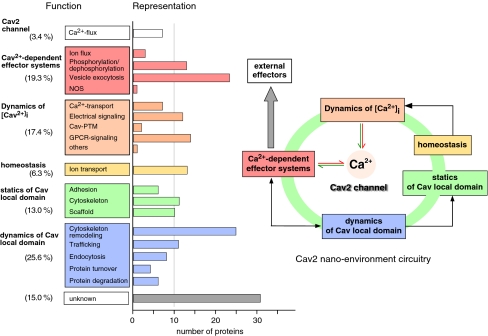
Local Ca(2+) signaling occurring within nanometers of voltage-gated Ca(2+) (Cav) channels is crucial for CNS function, yet the molecular composition of Cav channel nano-environments is largely unresolved. Here, we used a proteomic strategy combining knockout-controlled multiepitope affinity purifications with high-resolution quantitative MS for comprehensive analysis of the molecular nano-environments of the Cav2 channel family in the whole rodent brain. The analysis shows that Cav2 channels, composed of pore-forming alpha1 and auxiliary beta subunits, are embedded into protein networks that may be assembled from a pool of approximately 200 proteins with distinct abundance, stability of assembly, and preference for the three Cav2 subtypes. The majority of these proteins have not previously been linked to Cav channels; about two-thirds are dedicated to the control of intracellular Ca(2+) concentration, including G protein-coupled receptor-mediated signaling, to activity-dependent cytoskeleton remodeling or Ca(2+)-dependent effector systems that comprise a high portion of the priming and release machinery of synaptic vesicles. The identified protein networks reflect the cellular processes that can be initiated by Cav2 channel activity and define the molecular framework for organization and operation of local Ca(2+) signaling by Cav2 channels in the brain.


Conflict of interest statement

The authors declare no conflict of interest.

Figures

Fig. 1.
Fig. 1.
Proteomic approach used for analysis of Cav2 nano-environments in the mammalian brain. (A) Workflow of the proteomic analysis as detailed in the main text. (B) Solubilization efficiency of Cav2.2 channels under various conditions (input) and retrieval of Cav2 α1 proteins in subsequent APs (output). (Left) Solubilized (S) and nonsolubilized (P) protein fractions obtained with buffers CL-91, CL-114, and digitonin (Dig) from rat brain membranes (M), resolved by SDS/PAGE and Western-probed with the anti–Cav2.2-c antibody. (Right) Relative yield of the Cav2 α1 proteins (mean ± SD) determined by quantitative MS analysis in five APs using the indicated solubilization buffers and all anti-Cav2 α1 antibodies. (C) Determination of target specificity by abundance thresholds. Histogram plot summarizing abundance ratios (binned in logarithmic intervals; division of protein amounts obtained with Cav2 subunit-specific ABs in APs from WT and the respective knockout brains) of all proteins in all APs. Stacked bars in red are proteins exclusively detected in APs from WT or knockout brains. Continuous line represents distribution of the nonspecific proteins as obtained from fitting the sum of two Gaussians to the data; high-confidence threshold for specificity is indicated by the dashed line in green. (D) Summary of MS analyses used for identification of the protein constituents of Cav2 nano-environments. (Inset) Distribution of precursor mass error in ppm of all peptides identified by database searches with Mascot; green lines indicate m/z tolerance (± 8 ppm) used for PV assignment.
Fig. 2.
Fig. 2.
Subunit composition of the Cav2 channel core. (A) Relative sequence coverage of the indicated Cav2 α1 and Cav β subunits by peptides retrieved in MS. (B) Abundancenorm of the indicated proteins (color coded at logarithmic scale) in APs with the indicated solubilization buffers and anti-Cav2 ABs. Note robust and stoichiometric association of Cav β and Cav2 α1 proteins under all conditions; α2δ copurified only in APs with digitonin as a solubilizing detergent, and γ2–8 failed to copurify with Cav2 channels. (C) Cav2 channel subtypes exhibit distinct profiles for assembly with the Cav β subunits as derived from quantification of Cavβ1–Cavβ4 proteins (mean ± SD, determined from relative amounts of Cav β) in APs with the anti-Cav2 α1 ABs.
Fig. 3.
Fig. 3.
Composition of the Cav2 channel nano-environments in the brain. Proteins identified by the proteomic approach with CL-91 solubilized membrane fractions categorized according to their primary biochemical function. Red font marks proteins copurified also under high-stringency conditions (CL-114). The Cav2 channel core made up from one α1 (Cav2.×) and one β subunit (Cavβ1–4) is depicted as a structural model in space-filling mode (generated with the Maya platform; Materials and Methods and Table S3).
Fig. 4.
Fig. 4.
Structural aspects of Cav2 nano-environments. (A) Overlap in subtype preference and (B) cellular localization of all proteins identified in the Cav2 proteome. (C) Structural connections and subclusters within Cav2 nano-environments as revealed by scientific literature and correlation analyses; shown are only protein constituents for which at least one direct protein–protein interaction was identified. Diamonds denote high-stringency interactors (Fig. 3), and color coding depicts subtype preference as indicated on the right; oversized symbols reflect grouping of several subunits. Lines represent direct protein–protein interactions as suggested in literature (gray) or identified by correlation analysis (black).
Fig. 5.
Fig. 5.
Representation of cellular functions and operation circuitry of Cav2 nano-environments. (Left) Identified protein constituents of the Cav2 nano-environments grouped into six classes (boxed, numbers denoting relative participation) reflecting their functional significance for the signaling and operation of Cav2 networks. Bars illustrate representation of the respective function in the Cav2 proteome (Table S2). (Right) Operation of Cav2 nano-environments as a functional entity. Arrows in red and green represent positive and negative feedback of or onto free Ca2+ ions provided by the Cav2 channels, respectively; arrows in black denote modulatory activity between proteins of the respective functional groups. Details on organization and circuitry are discussed in the main text.
Fig. 6.
Fig. 6.
Molecular modeling of Cav2 nano-environments in the presynapse. Selected proteins of the Cav2 channel proteome with documented localization to the presynaptic compartment arranged to reflect their function (as obtained from public databases), molecular structure (pdb database) (Table S3), abundance (Table 1), and clustering (Fig. 4C). All proteins are represented as space-filling models, and the BKCa-Cav2 complex (A, left side; ∼1.6 MDa) (17) may serve as size reference. SV, releasable synaptic vesicle. Views in A–C are related to each other by the indicated rotations around an axis perpendicular to the membrane; (C) is additionally rotated by ∼60° around a horizontal axis. (Inset) Projection of the nano-environment into a small synapse (diameter = 1 μm).

Comment in

References

    1. Berridge MJ, Lipp P, Bootman MD. The versatility and universality of calcium signalling. Nat Rev Mol Cell Biol. 2000;1:11–21. - PubMed
    1. Clapham DE. Calcium signaling. Cell. 2007;131:1047–1058. - PubMed
    1. Augustine GJ, Santamaria F, Tanaka K. Local calcium signaling in neurons. Neuron. 2003;40:331–346. - PubMed
    1. Neher E. Vesicle pools and Ca2+ microdomains: New tools for understanding their roles in neurotransmitter release. Neuron. 1998;20:389–399. - PubMed
    1. Fakler B, Adelman JP. Control of K(Ca) channels by calcium nano/microdomains. Neuron. 2008;59:873–881. - PubMed

Publication types