. 2010 Jul 23;5(7):e11734.
doi: 10.1371/journal.pone.0011734.

Identification of roles for peptide: N-glycanase and endo-beta-N-acetylglucosaminidase (Engase1p) during protein N-glycosylation in human HepG2 cells

Affiliations

Identification of roles for peptide: N-glycanase and endo-beta-N-acetylglucosaminidase (Engase1p) during protein N-glycosylation in human HepG2 cells

Isabelle Chantret et al. PLoS One. .

Abstract

Background: During mammalian protein N-glycosylation, 20% of all dolichol-linked oligosaccharides (LLO) appear as free oligosaccharides (fOS) bearing the di-N-acetylchitobiose (fOSGN2), or a single N-acetylglucosamine (fOSGN), moiety at their reducing termini. After sequential trimming by cytosolic endo beta-N-acetylglucosaminidase (ENGase) and Man2c1 mannosidase, cytosolic fOS are transported into lysosomes. Why mammalian cells generate such large quantities of fOS remains unexplored, but fOSGN2 could be liberated from LLO by oligosaccharyltransferase, or from glycoproteins by NGLY1-encoded Peptide-N-Glycanase (PNGase). Also, in addition to converting fOSGN2 to fOSGN, the ENGASE-encoded cytosolic ENGase of poorly defined function could potentially deglycosylate glycoproteins. Here, the roles of Ngly1p and Engase1p during fOS metabolism were investigated in HepG2 cells.

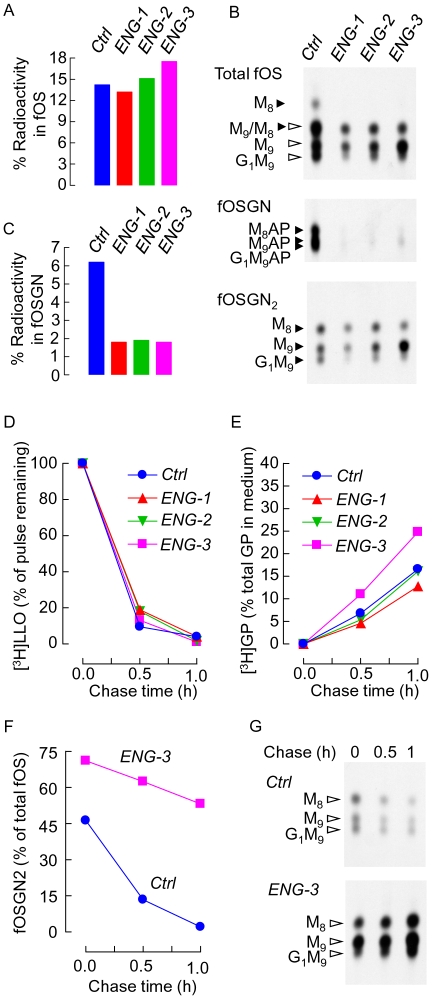
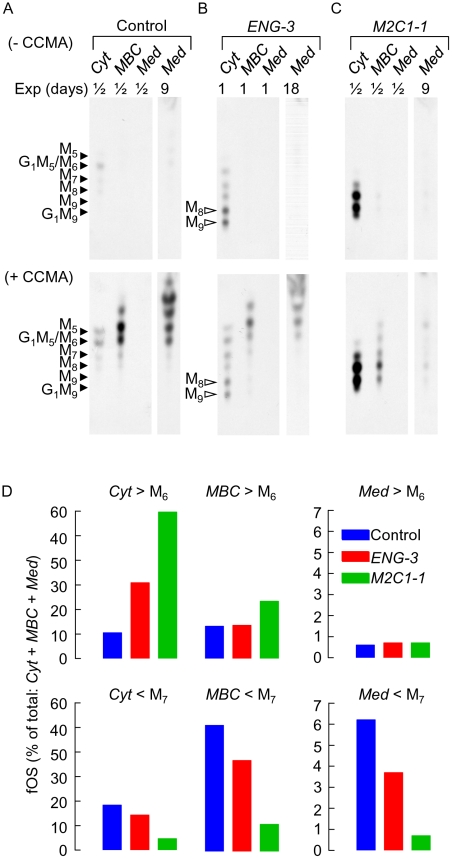
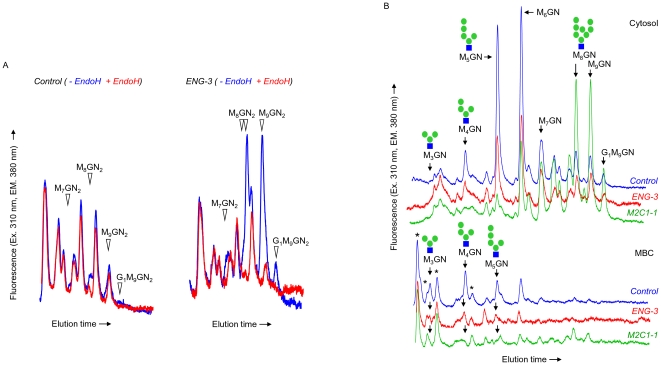
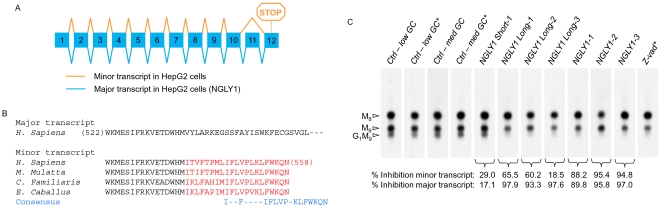
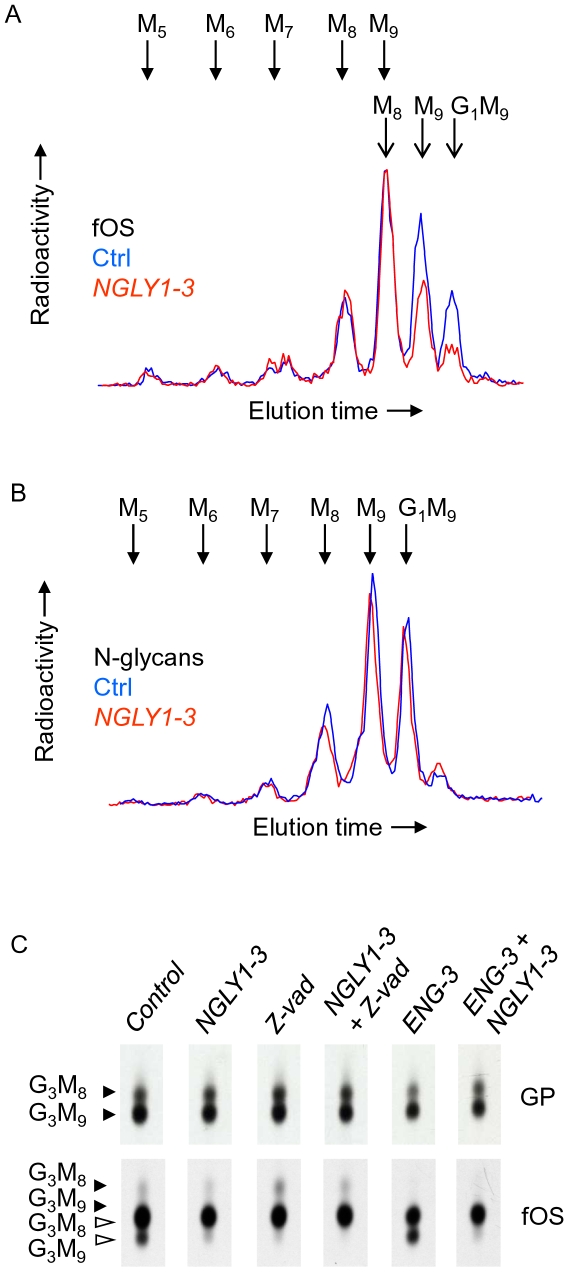
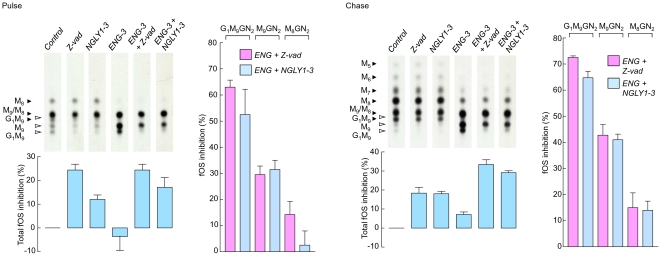
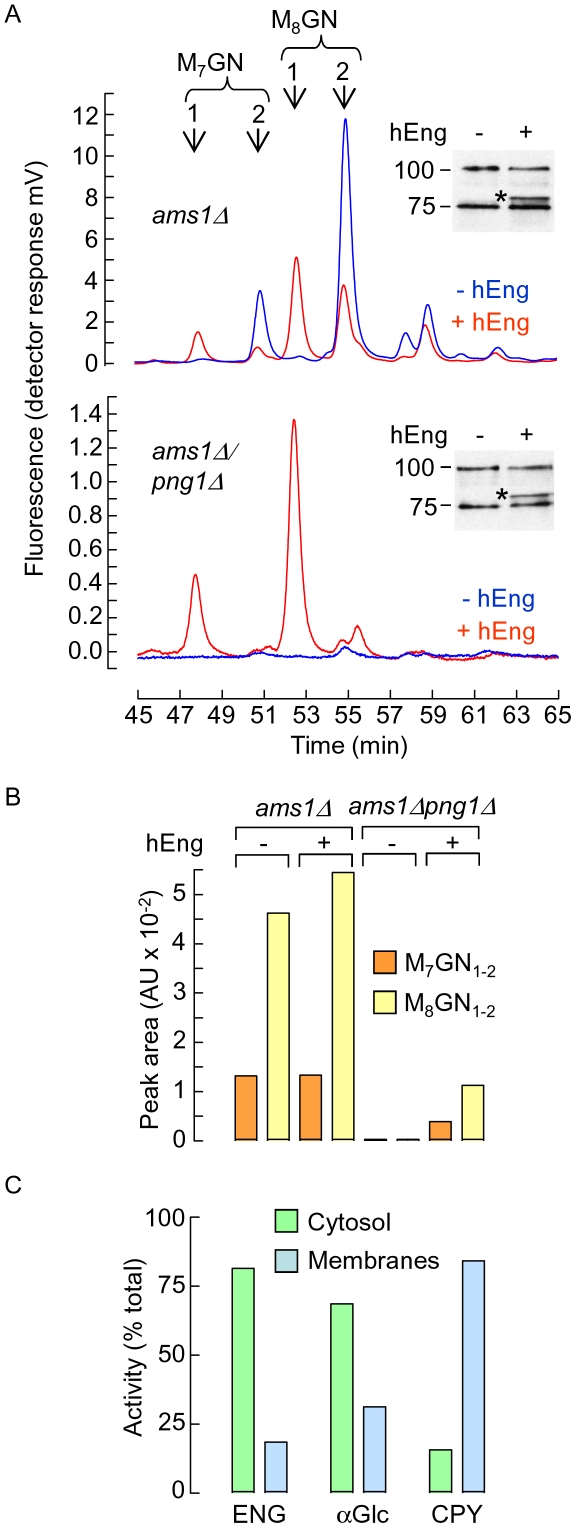
Methods/principal findings: During metabolic radiolabeling and chase incubations, RNAi-mediated Engase1p down regulation delays fOSGN2-to-fOSGN conversion, and it is shown that Engase1p and Man2c1p are necessary for efficient clearance of cytosolic fOS into lysosomes. Saccharomyces cerevisiae does not possess ENGase activity and expression of human Engase1p in the png1Delta deletion mutant, in which fOS are reduced by over 98%, partially restored fOS generation. In metabolically radiolabeled HepG2 cells evidence was obtained for a small but significant Engase1p-mediated generation of fOS in 1 h chase but not 30 min pulse incubations. Ngly1p down regulation revealed an Ngly1p-independent fOSGN2 pool comprising mainly Man(8)GlcNAc(2), corresponding to approximately 70% of total fOS, and an Ngly1p-dependent fOSGN2 pool enriched in Glc(1)Man(9)GlcNAc(2) and Man(9)GlcNAc(2) that corresponds to approximately 30% of total fOS.

Conclusions/significance: As the generation of the bulk of fOS is unaffected by co-down regulation of Ngly1p and Engase1p, alternative quantitatively important mechanisms must underlie the liberation of these fOS from either LLO or glycoproteins during protein N-glycosylation. The fully mannosylated structures that occur in the Ngly1p-dependent fOSGN2 pool indicate an ERAD process that does not require N-glycan trimming.


Conflict of interest statement

Competing Interests: The authors have declared that no competing interests exist.

Figures

Figure 1
Figure 1. ENGASE mRNA silencing alters fOS metabolism.
A. Three days post transfection with 25 pmoles of control RNAi duplexes (Ctrl) or ENGASE RNAi duplexes (ENG-1, ENG-2 and ENG-3), cells were pulse-radiolabeled with [2-3H]mannose for 30 min. Incorporation of [2-3H]mannose into LLO, Glycoproteins and fOS was measured and summed to give total cellular radioactivity. The percentage of this total occurring as [2-3H]fOS was calculated. B. [2-3H]fOS were resolved by TLC (upper panel). After derivatisation with 2-aminopyridine, EndoH digestion and fractionation of incubation mixtures on AG-50 ion-exchange resin, [2-3H]fOS were separated into [2-3H]fOSGN (originally fOSGN2) and [2-3H]fOSGN-AP (originally fOSGN) before analysis by TLC. The migration positions of standard oligosaccharides or oligosaccharide AP-derivatives are shown to the left of the chromatographs. Closed and open arrowheads indicate the migration positions of fOSGN and fOSGN2 respectively. The abbreviations are: G1M9; Glc1Man9GlcNAc1-2, M9; Man9GlcNAc1-2, M8; Man8GlcNAc1-2. C. The percentage of total radioactivity incorporated into LLO glycoproteins and fOS recovered as [2-3H]fOSGN was calculated. D-E. Cells transfected with either ENG-1, ENG-2, ENG-3 or control RNAi duplexes were pulse radiolabeled for 30 min (t = 0) and then chased in normal growth medium for 30 min and 1 h. D. [3H]LLO were recovered from the cells and quantitated by scintillation counting. E. [3H]glycoproteins were recovered from the cells and incubation media and the percentage of total [3H]glycoproteins (cells+medium) recovered from the media is reported. F-G. Cells transfected with ENG-3 or control RNAi duplexes were pulse radiolabeled for 30 min and then chased in normal growth medium for 30 min and 1 h. F. After recovery of fOS, the amount of fOS occurring as fOSGN2 was calculated as percentage of total fOS. G. Examination of the fOSGN2 species by TLC. Although the effects of the different RNAi duplexes were noted several times and found to be reproducible, the detailed analyses shown in A,C, and D-G were performed once.
Figure 2
Figure 2. Subcellular distribution of fOS in control and CCMA-treated cells after down regulation of Engase1p and Man2c1p.
Three days after cells were transiently transfected with either (A) control RNAi duplexes (Control) or (B) RNAi duplexes targeting ENGASE (ENG-3) or (C) MAN2C1 (M2C1-1), cells were pulse-radiolabeled with [2-3H]mannose, and submitted to 6 h chase incubations in the absence (A, B and C, upper panels) or the presence of 10 nM CCMA (A, B and C, lower panels). Cells were then permeabilized with SLO as described in Material and Methods. fOS purified from the cytosolic fraction (Cyt) and the membrane bound compartments (MBC) and from the chase media (Med) were resolved by TLC. TLC plates were exposed to film for different numbers of days (Exp) in order to better visualise components whose abundances differ greatly between conditions. The migration positions of standard oligosaccharides are shown to the left of the chromatographs and the abbreviations associated with the open arrowheads are: M9, Man9GlcNAc2; M8, Man8GlcNAc2; the abbreviations associated with the closed arrowheads are: G1M9, GlcMan9GlcNAc; M9, Man9GlcNAc; M8, Man8GlcNAc; M7, Man7GlcNAc; M6, Man6GlcNAc; G1M5, GlcMan5GlcNAc; and M5, Man5GlcNAc. D. Oligosaccharides were eluted from the chromatograms corresponding to the fluorograms shown in the lower panels of A, B and C (+ CCMA) and quantitated by scintillation counting. To simplify interpretation of results, radioactivity associated with oligosaccharides greater in size than Man6GlcNAc (> M6) was summed as was that obtained for oligosaccharides smaller than Man7GlcNAc (< M7). The bars indicate the percentage of total fOS recovered from each incubation. This experiment was performed once.
Figure 3
Figure 3. Effects of Engase1p and Man2c1p down regulation on steady-state levels of cytosolic and MBC fOS in HepG2 cells.
fOS recovered from both the cytosol and the MBC fractions of SLO-permeabilized, control siRNA (Control), ENG-3 or M2C1-1 -transfected cells, were derivatized with 2-AP, and analyzed by HPLC before (− EndoH) and after digestion with EndoH from S. plicatus (+ EndoH). A. HPLC profiles of the cytosolic PA-derivatized fOS obtained before (Blue traces) and after EndoH (Red traces) digestion from control siRNA (Left panel) or ENG-3 (Right panel) transfected HepG2 cells. The open arrowheads indicate the migration positions of fOSGN2-AP derivatives whose appearance is abrogated after EndoH digestion. Only the region of the chromatograms that display significant differences before and after EndoH digestion is shown. B. The EndoH treated fOS from the cytosol (Upper panel) and membrane bound compartments MBC (Lower panel) were resolved by HPLC and the migration positions of standard radioactive oligosaccharide 2-AP derivatives are indicated, and where known, the isomeric configuration of the standard structures are indicated (Green circles; mannose, blue squares; N-acetylglucosamine). The asteriks indicate peaks corresponding to oligosaccharides whose abundance does not change under the different conditions. In both A and B the background noise associated with the ENG-3 profiles is higher than in either the control or M2C1-3 traces because the fluorescence scale was amplified to take into account the smaller amount of cells recovered from ENG-3 transfected cultures. This experiment was performed once, but a preliminary experiment, in which cells were not permeabilised with SLO, was performed and found to give qualitatively similar results.
Figure 4
Figure 4. Alternative NGLY1 transcripts and the impact of their down regulation on fOS generation in HepG2 cells.
A. Genomic organization of the human NGLY1 gene and alternative transcripts found in HepG2 cells. The major transcript found in HepG2 cells is indicated in blue and corresponds to the already published NGLY1 mRNA sequence (NM_018297.3). A minor transcript indicated in orange is generated by skipping of exon 11 (NM_001145295.1). B. Partial alignment of homologous Ngly1p sequences (amino acids 522–558) encoded by the minor transcript and comparison with the corresponding region of the major NGLY1 transcript (accession numbers: Macaca mulatta; XP_001092914, Equus caballus; XP_001492093, Canis lupus familiaris; DN746692.1). Note that the isoform encoded by the minor transcript contains 21 amino acids in its COOH terminal which are not found in the peptide sequence encoded by the major transcript. C. HepG2 cells were transiently transfected with the different siRNA duplexes designed to silence either or both NGLY1 transcripts (see Table S1). Total RNA were extracted three days later and the mRNA levels of each specific transcript were analyzed by QPCR. In parallel, HepG2 cells were co transfected with ENG-3 and the different siRNA duplexes targeting the two NGLY1 transcripts. As described in Materials and Methods, because of the variable GC content of the different RNAi duplexes, two negative control siRNA duplexes with either medium (med GC) or low GC (low GC) content were used. After 3 days cells were pulse-radiolabeled with [2-3H]mannose for 30 min. In some experiments, cells transfected with ENG-3 alone or with control RNAi duplexes were treated with either Z-vad-fmk (40 µM) dissolved in DMSO (Z-vad*) or DMSO alone (*) for 45 min prior to, and during the radiolabeling period. Subsequently, [2-3H]fOS, [2-3H]LLO and [2-3H]Glycoproteins were extracted, purified and quantitated, and [2-3H]fOS were analysed by TLC. In order to take into account the differences in total incorporation of radiolabel into cells cultivated under the different conditions, a fraction of total fOS was loaded onto the TLC according to the ratio of the total cellular radioactivity for a given incubation to that recovered from the incubation incorporating least radioactivity. The scanned TLC lanes are from the same fluorograph, but due to uneven migration, the scans were aligned manually to facilitate interpretation of data. The migration positions of standard oligosaccharides are shown to the left of the chromatograms and the abbreviations used are as described in Fig 1. The percent inhibition of the major and minor NGLY1 transcripts provoked by the different RNAi duplexes was calculated using the QPCR data and is indicated underneath the appropriate lanes. This experiment was performed once.
Figure 5
Figure 5. Examination of fOS, and N-glycans after NGLY1-3 or Z-vad mediated reduction of Ngly1p activity in control and castanospermine-treated cells.
A. HepG2 cells were transfected with 25 pmoles of control siRNA (Ctrl), or 25 pmoles of NGLY1-3. Three days after transfection, cells were pulse-radiolabeled with [2-3H]mannose for 30 min and cellular EndoH-released [2-3H]N-glycans (N-glycans) and [2-3H]fOS (fOS) were prepared and analysed by HPLC. Whereas the whole fOS fractions were analysed, only 25% of the N-glycan fractions were examined by HPLC. The elution positions of standard oligosaccharides are indicated above the HPLC profiles and the abbreviations used are defined in the legend for Fig 2. B. HepG2 cells were transfected with 50 pmoles of control siRNA (Ctrl), or 25 pmoles each of NGLY1-3 and 25 pmoles of control siRNA (NGLY), or 25 pmoles each of ENG-3 and 25 pmoles of control siRNA (ENG), or 25 pmoles each of NGLY1-3 and ENG-3 (ENG + NGLY). Three days after transfection, cells were preincubated for 30 min with 2 mM castanospermine (CST), and where indicated, with 40 µM Z-vad-fmk (Z-vad). Cells were then pulse-radiolabeled with [2-3H]mannose for 30 min and cellular EndoH-released [2-3H]N-glycans (GP) and [2-3H]fOS (fOS) were prepared and examined by TLC. The scanned TLC lanes are from the same fluorograph, but due to uneven migration, the scans were aligned manually to facilitate interpretation of data. Closed and open arrowheads indicate the migration positions of components bearing one or two residues, respectively, of GlcNAc at their reducing end. The abbreviations are: G3M9; Glc3Man9GlcNAc1-2, G3M8; Glc3Man8GlcNAc1-2. C. These experiments were performed once.
Figure 6
Figure 6. Quantitation of Ngly1p-dependent and -independent fOS pools in HepG2 cells.
Cells were transfected with 50 pmoles of control siRNA (Ctrl and Z-vad), or 25 pmoles each of NGLY1-3 and 25 pmoles of control siRNA (NGLY), or 25 pmoles each of ENG-3 and 25 pmoles of control siRNA (ENG), or 25 pmoles each of NGLY1-3 and ENG-3 (ENG + NGLY). Three days after transfection, where indicated, cells were preincubated for 30 min with 40 µM Z-vad-fmk (Z-vad). Cells were then pulse-radiolabeled in either the absence or presence of Z-vad with [2-3H]mannose for 30 min (Pulse, left panels) or pulse-radiolabeled for 30 min prior to conducting a 1 h chase incubation (Chase, right panels). [2-3H]lipid-linked oligosaccharides, [2-3H]N-glycans released by EndoH from both cellular and medium glycoproteins and [2-3H]fOS were prepared and quantitated by scintillation counting. After summing the radioactivity associated with the above described fractions to generate total radioactivity incorporation into cells. [2-3H]fOS were examined by TLC. In order to take into account the differences in total incorporation of radiolabel into cells cultivated under the different conditions, the fraction of total fOS that was loaded onto the TLC was adjusted to take into account the ratio of the total cellular radioactivity for a given incubation to that recovered from the incubation incorporating least radioactivity. The migration positions of standard oligosaccharides are shown to the left of the chromatograms and the abbreviations used are as described in Fig 2. After elution of the oligosaccharide components from TLC plates and quantitation by scintillation counting, inhibition of total fOS appearance with respect to the control was calculated and is shown under the appropriate TLC lanes. The percentage inhibitions of individual oligosaccharides (Glc1Man9GlcNAc2: G1M9, Man9GlcNAc2: M9, Man8GlcNAc2: M8) observed in the ENG + NGLY and ENG + Z-vad conditions with respect to the ENG condition are shown to the right of the chromatograms. The scanned TLC lanes are from the same fluorograph, but due to uneven migration, the scans were aligned manually to facilitate interpretation of data. This experiment was repeated 4 times and the error bars represent the standard deviation.
Figure 7
Figure 7. Examination of the deglycosylating role of human Engase1p in Png1p-deficient yeast cells.
A. Obtention of the S. cerevisiae ams1Δ and ams1Δpng1Δ strains, deficient in the vacuolar mannosidase, Ams1p, and their transfection with an empty vector or a vector encoding Hist-tagged human Engase1p, is described in Materials and Methods. Cells were grown to mid log phase and fOS were extracted, purified and derivatised with 2-AP. Derivatised fOS (corresponding to 146, 92, 166 and 88 DU600 nm for the ams1Δ, ams1ΔhENGASE, ams1Δpng1Δ and ams1Δpng1ΔhENGASE strains, respectively) were resolved by HPLC and detected using an on line fluorescence detector. Arrows indicate the elution times of fOS containing either a single (1) or two (2) residues of N-acetylglucosamine at their reducing termini. Insets. The ams1Δ (upper panel) and ams1Δpng1Δ (lower panel) strains transfected with the empty vector (− hEngase1p) or the vector encoding Hist-tagged human Engase1p (+ hEngase1p) were grown to mid log phase and cell extracts were probed with an anti Hist tag antibody after SDS PAGE by Western blot. Hist-tagged hEngase1p (*) has a molecular mass of 80 kDa. The migration position of 100 and 75 kDa markers are indicated to the left of the blots. B. After correction for the different quantities of starting material used for each yeast strain the areas under the HPLC peaks corresponding to Man7GlcNAc2 and Man7GlcNAc (M7GN1-2) were summed, as were those for Man8GlcNAc2 and Man8GlcNAc (M8GN1-2). C. Wild type cells were transfected with the vector encoding Hist-tagged human Engase1p, grown to mid log phase, converted into spheroplasts, and permeabilised as described in Materials and Methods. After centrifugation, cytosol and membrane fractions were assayed for Engase1p (ENG), cytosolic α-glucosidase (αGlc) and vacuolar carboxypeptidase Y (CPY) activities which have been expressed as a percentage of the sum of the cytosol and membrane values. This experiment was performed once.

Similar articles

Cited by

References

    1. Kornfeld R, Kornfeld S. Assembly of asparagine-linked oligosaccharides. Annu Rev Biochem. 1985;54:631–664. - PubMed
    1. Helenius A, Aebi M. Intracellular functions of N-linked glycans. Science. 2001;291:2364–2369. - PubMed
    1. Chantret I, Moore SE. Free oligosaccharide regulation during mammalian protein N-glycosylation. Glycobiology. 2008;18:210–224. - PubMed
    1. Spiro RG. Role of N-linked polymannose oligosaccharides in targeting glycoproteins for endoplasmic reticulum-associated degradation. Cell Mol Life Sci. 2004;61:1025–1041. - PMC - PubMed
    1. Anumula KR, Spiro RG. Release of glucose-containing polymannose oligosaccharides during glycoprotein biosynthesis. Studies with thyroid microsomal enzymes and slices. J Biol Chem. 1983;258:15274–15282. - PubMed

Publication types

MeSH terms