

Estrogen receptor beta-selective agonists stimulate calcium oscillations in human and mouse embryonic stem cell-derived neurons
- PMID: 20668547
- PMCID: PMC2910705
- DOI: 10.1371/journal.pone.0011791
Estrogen receptor beta-selective agonists stimulate calcium oscillations in human and mouse embryonic stem cell-derived neurons
Abstract
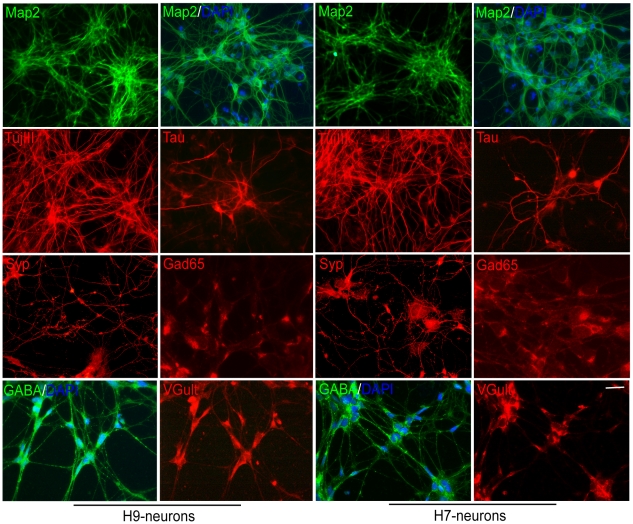
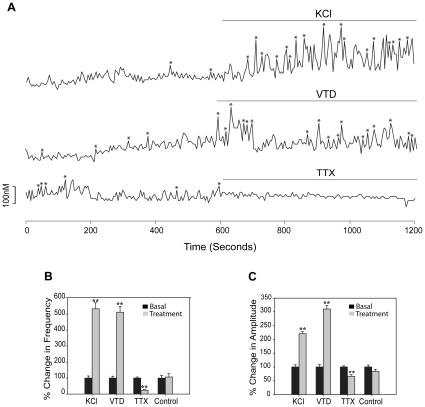
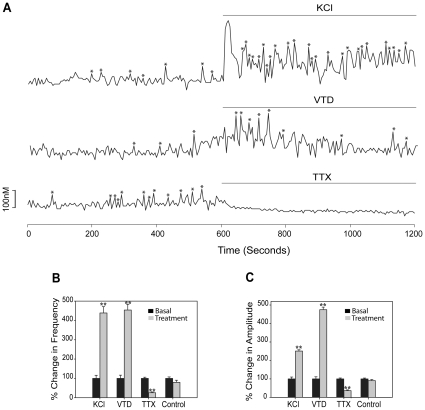
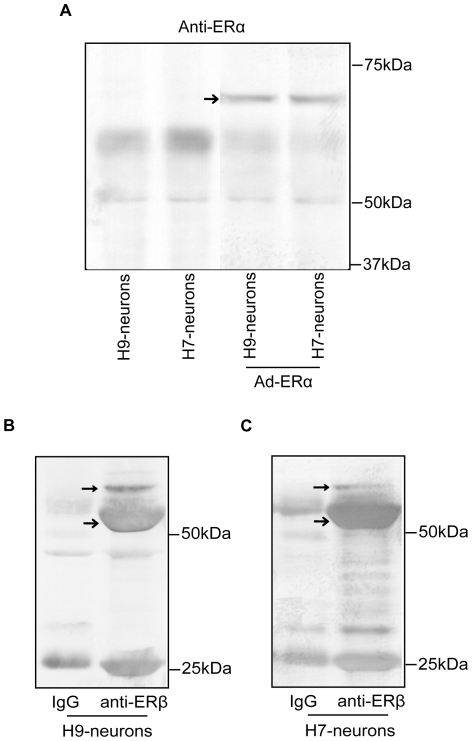
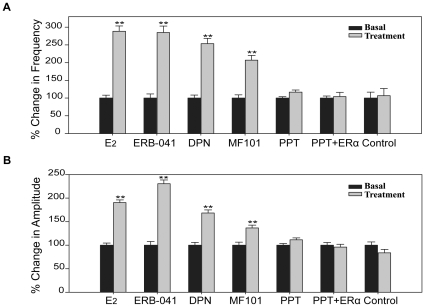
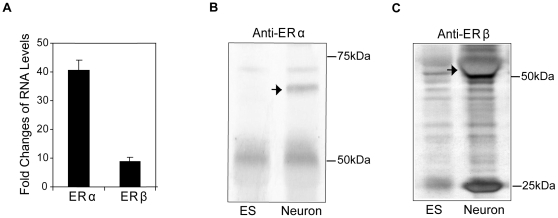
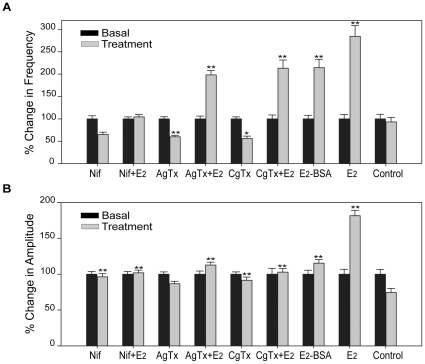
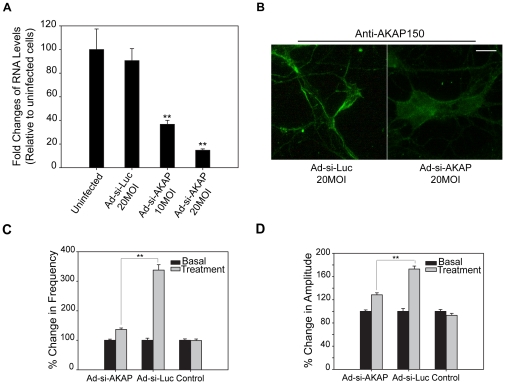
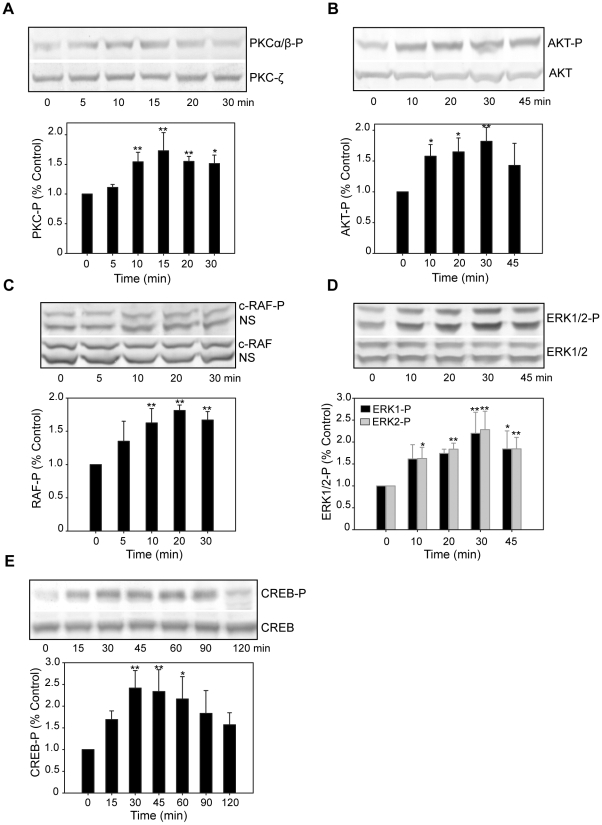
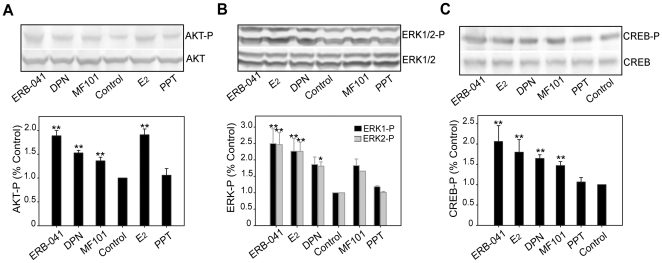
Estrogens are used extensively to treat hot flashes in menopausal women. Some of the beneficial effects of estrogens in hormone therapy on the brain might be due to nongenomic effects in neurons such as the rapid stimulation of calcium oscillations. Most studies have examined the nongenomic effects of estrogen receptors (ER) in primary neurons or brain slices from the rodent brain. However, these cells can not be maintained continuously in culture because neurons are post-mitotic. Neurons derived from embryonic stem cells could be a potential continuous, cell-based model to study nongenomic actions of estrogens in neurons if they are responsive to estrogens after differentiation. In this study ER-subtype specific estrogens were used to examine the role of ERalpha and ERbeta on calcium oscillations in neurons derived from human (hES) and mouse embryonic stem cells. Unlike the undifferentiated hES cells the differentiated cells expressed neuronal markers, ERbeta, but not ERalpha. The non-selective ER agonist 17beta-estradiol (E(2)) rapidly increased [Ca2+]i oscillations and synchronizations within a few minutes. No change in calcium oscillations was observed with the selective ERalpha agonist 4,4',4''-(4-Propyl-[1H]-pyrazole-1,3,5-triyl)trisphenol (PPT). In contrast, the selective ERbeta agonists, 2,3-bis(4-Hydroxyphenyl)-propionitrile (DPN), MF101, and 2-(3-fluoro-4-hydroxyphenyl)-7-vinyl-1,3 benzoxazol-5-ol (ERB-041; WAY-202041) stimulated calcium oscillations similar to E(2). The ERbeta agonists also increased calcium oscillations and phosphorylated PKC, AKT and ERK1/2 in neurons derived from mouse ES cells, which was inhibited by nifedipine demonstrating that ERbeta activates L-type voltage gated calcium channels to regulate neuronal activity. Our results demonstrate that ERbeta signaling regulates nongenomic pathways in neurons derived from ES cells, and suggest that these cells might be useful to study the nongenomic mechanisms of estrogenic compounds.
Conflict of interest statement
Figures
Similar articles
-
Estrogen receptor alpha and beta differentially regulate intracellular Ca(2+) dynamics leading to ERK phosphorylation and estrogen neuroprotection in hippocampal neurons.Brain Res. 2007 Oct 3;1172:48-59. doi: 10.1016/j.brainres.2007.06.092. Epub 2007 Jul 31. Brain Res. 2007. PMID: 17803971
-
Estrogen receptor α mediates proliferation of osteoblastic cells stimulated by estrogen and mechanical strain, but their acute down-regulation of the Wnt antagonist Sost is mediated by estrogen receptor β.J Biol Chem. 2013 Mar 29;288(13):9035-48. doi: 10.1074/jbc.M112.405456. Epub 2013 Jan 29. J Biol Chem. 2013. PMID: 23362266 Free PMC article.
-
Sex specific response of cultured human bone cells to ERα and ERβ specific agonists by modulation of cell proliferation and creatine kinase specific activity.J Steroid Biochem Mol Biol. 2011 Jul;125(3-5):226-30. doi: 10.1016/j.jsbmb.2011.03.006. Epub 2011 Mar 21. J Steroid Biochem Mol Biol. 2011. PMID: 21397017
-
Contribution of estrogen receptors alpha and beta to the effects of estradiol in the brain.J Steroid Biochem Mol Biol. 2008 Feb;108(3-5):327-38. doi: 10.1016/j.jsbmb.2007.09.011. Epub 2007 Sep 7. J Steroid Biochem Mol Biol. 2008. PMID: 17936613 Review.
-
Molecular mechanisms of estrogen action: selective ligands and receptor pharmacology.J Steroid Biochem Mol Biol. 2000 Nov 30;74(5):279-85. doi: 10.1016/s0960-0760(00)00104-7. J Steroid Biochem Mol Biol. 2000. PMID: 11162936 Review.
Cited by
-
Plasticity of calcium signaling cascades in human embryonic stem cell-derived neural precursors.Stem Cells Dev. 2013 May 15;22(10):1506-21. doi: 10.1089/scd.2012.0624. Epub 2013 Feb 19. Stem Cells Dev. 2013. PMID: 23294113 Free PMC article.
-
Estrogen receptor beta modulates permeability transition in brain mitochondria.Biochim Biophys Acta Bioenerg. 2018 Jun;1859(6):423-433. doi: 10.1016/j.bbabio.2018.03.006. Epub 2018 Mar 14. Biochim Biophys Acta Bioenerg. 2018. PMID: 29550215 Free PMC article.
-
Development of subtype-selective oestrogen receptor-based therapeutics.Nat Rev Drug Discov. 2011 Sep 16;10(10):778-92. doi: 10.1038/nrd3551. Nat Rev Drug Discov. 2011. PMID: 21921919 Review.
-
Utilization of Human Induced Pluripotent Stem Cells-Derived In vitro Models for the Future Study of Sex Differences in Alzheimer's Disease.Front Aging Neurosci. 2021 Nov 4;13:768948. doi: 10.3389/fnagi.2021.768948. eCollection 2021. Front Aging Neurosci. 2021. PMID: 34803659 Free PMC article.
-
Estrogen Receptor Beta: The Promising Biomarker and Potential Target in Metastases.Int J Mol Sci. 2021 Feb 6;22(4):1656. doi: 10.3390/ijms22041656. Int J Mol Sci. 2021. PMID: 33562134 Free PMC article. Review.
References
-
- Beyer C. Estrogen and the developing mammalian brain. Anat Embryol (Berl) 1999;199:379–390. - PubMed
-
- Matsumoto A, Arai Y. Neuronal plasticity in the deafferented hypothalamic arcuate nucleus of adult female rats and its enhancement by treatment with estrogen. J Comp Neurol. 1981;197:197–205. - PubMed
-
- Nadal A, Diaz M, Valverde MA. The estrogen trinity: membrane, cytosolic, and nuclear effects. News Physiol Sci. 2001;16:251–255. - PubMed
-
- Behl C. Oestrogen as a neuroprotective hormone. Nat Rev Neurosci. 2002;3:433–442. - PubMed
Publication types
MeSH terms
Substances
Grants and funding
LinkOut - more resources
Full Text Sources
Miscellaneous
