. 2010 Jul 26;5(7):e11786.
doi: 10.1371/journal.pone.0011786.

KRIT1 regulates the homeostasis of intracellular reactive oxygen species

Affiliations

KRIT1 regulates the homeostasis of intracellular reactive oxygen species

Luca Goitre et al. PLoS One. .

Erratum in

Abstract

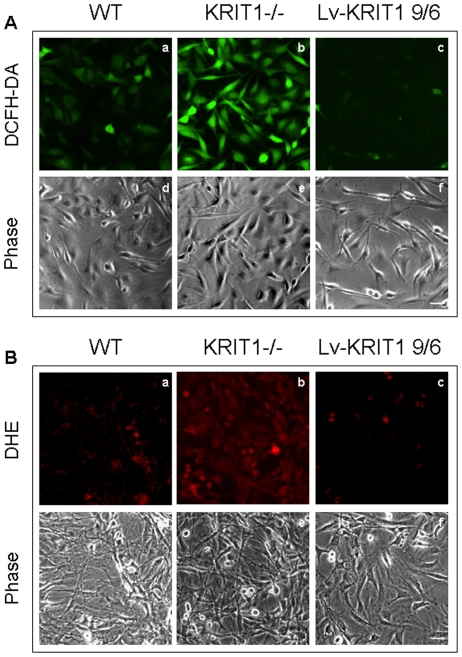
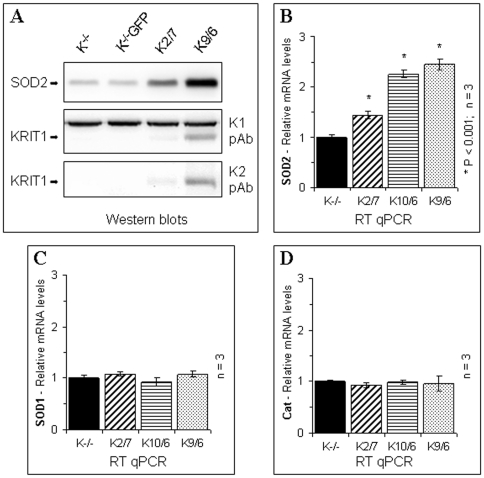
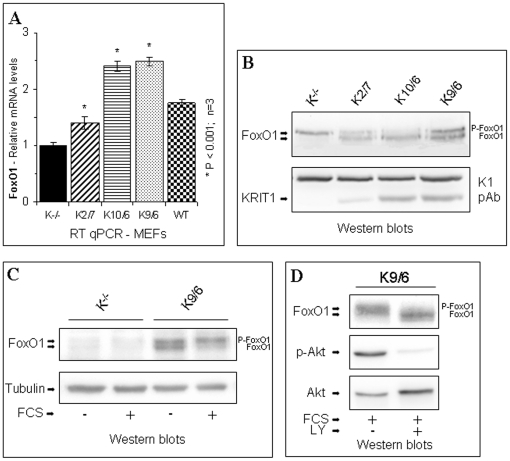
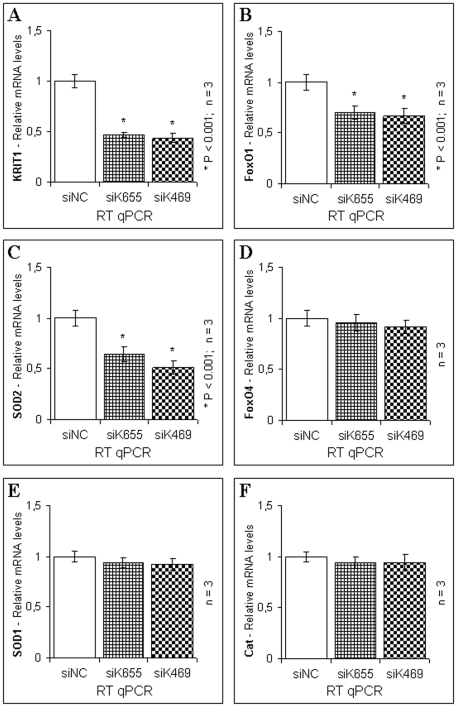
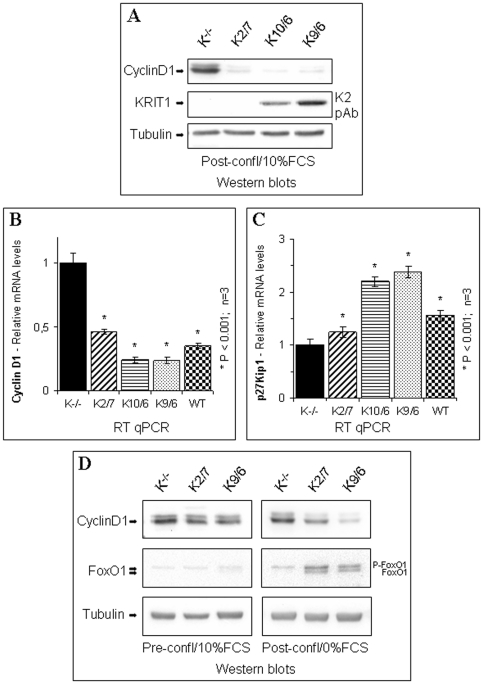
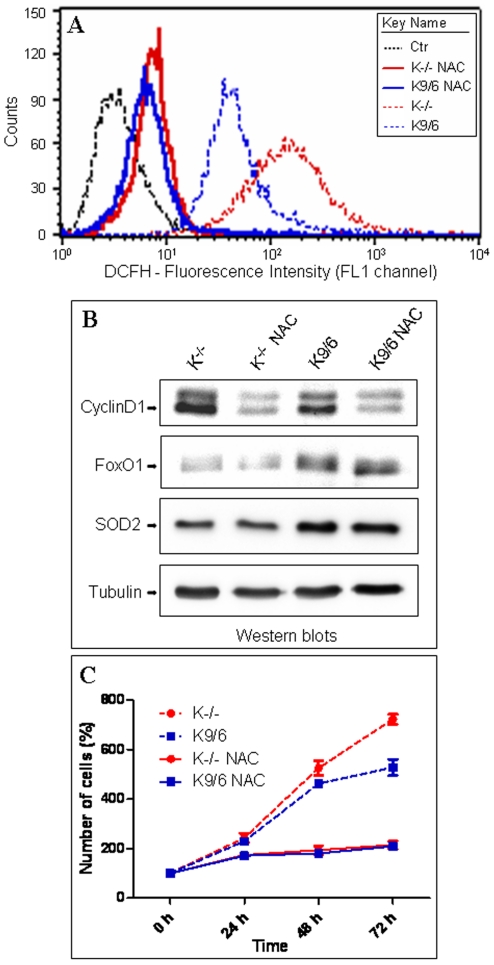
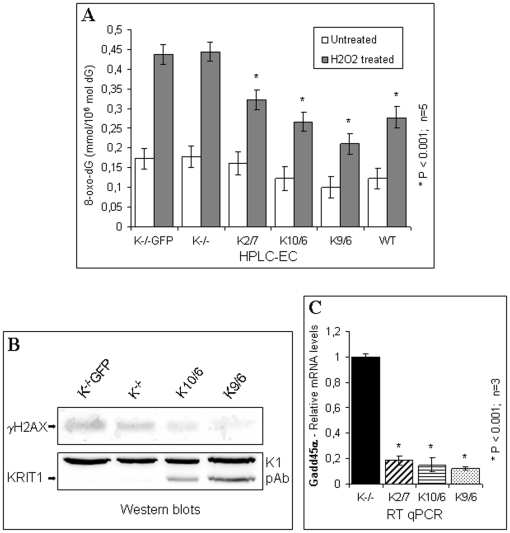
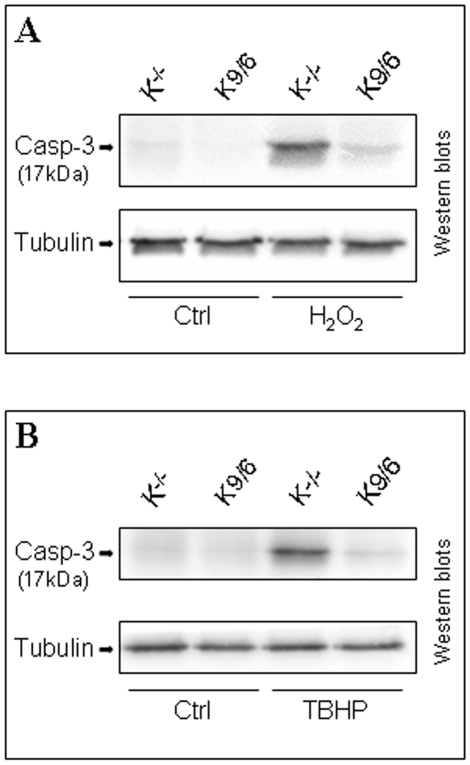
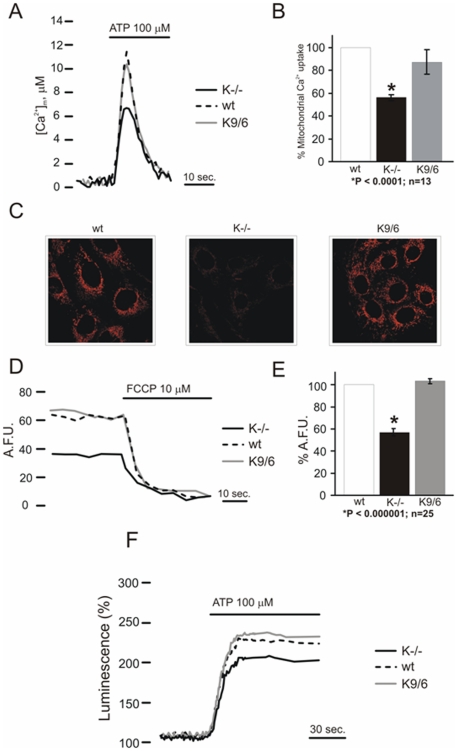
KRIT1 is a gene responsible for Cerebral Cavernous Malformations (CCM), a major cerebrovascular disease characterized by abnormally enlarged and leaky capillaries that predispose to seizures, focal neurological deficits, and fatal intracerebral hemorrhage. Comprehensive analysis of the KRIT1 gene in CCM patients has suggested that KRIT1 functions need to be severely impaired for pathogenesis. However, the molecular and cellular functions of KRIT1 as well as CCM pathogenesis mechanisms are still research challenges. We found that KRIT1 plays an important role in molecular mechanisms involved in the maintenance of the intracellular Reactive Oxygen Species (ROS) homeostasis to prevent oxidative cellular damage. In particular, we demonstrate that KRIT1 loss/down-regulation is associated with a significant increase in intracellular ROS levels. Conversely, ROS levels in KRIT1(-/-) cells are significantly and dose-dependently reduced after restoration of KRIT1 expression. Moreover, we show that the modulation of intracellular ROS levels by KRIT1 loss/restoration is strictly correlated with the modulation of the expression of the antioxidant protein SOD2 as well as of the transcriptional factor FoxO1, a master regulator of cell responses to oxidative stress and a modulator of SOD2 levels. Furthermore, we show that the KRIT1-dependent maintenance of low ROS levels facilitates the downregulation of cyclin D1 expression required for cell transition from proliferative growth to quiescence. Finally, we demonstrate that the enhanced ROS levels in KRIT1(-/-) cells are associated with an increased cell susceptibility to oxidative DNA damage and a marked induction of the DNA damage sensor and repair gene Gadd45alpha, as well as with a decline of mitochondrial energy metabolism. Taken together, our results point to a new model where KRIT1 limits the accumulation of intracellular oxidants and prevents oxidative stress-mediated cellular dysfunction and DNA damage by enhancing the cell capacity to scavenge intracellular ROS through an antioxidant pathway involving FoxO1 and SOD2, thus providing novel and useful insights into the understanding of KRIT1 molecular and cellular functions.


Conflict of interest statement

Competing Interests: The authors have declared that no competing interests exist.

Figures

Figure 1
Figure 1. KRIT1 knockout by homologous recombination.
A) Targeting strategy to generate the KRIT1 knockout allele (see Materials and Methods for details). B) Southern blotting of EcoRV-digested genomic DNA with a 700 bp KRIT1 probe mapping downstream of the targeting vector. The 16.8 and 9.5 Kb bands correspond to the wild-type (WT) and recombinant (Rec) allele, respectively. The 262 and 333 ES clones are heterozygous for the recombinant allele. C–D) PCR genotyping of embryo (C) and newborn (D) mice. The 300 and 809 bp bands correspond to the wild-type (WT) and recombinant (Rec) allele, respectively. Wt, Ht, Hm indicate wild-type, heterozygous, and homozygous genotypes, respectively. c-Wt and c-Ht are positive controls. No homozygous mutant mice were born.
Figure 2
Figure 2. Lentiviral re-expression of KRIT1 in KRIT1−/− MEF cells.
A–B) Western blot analysis of KRIT1−/− and KRIT1+/+ MEF cell lysates assessing the lack of KRIT1 expression in KRIT1−/− MEF cells and the detection of the specific 80 kDa band by two distinct anti-KRIT1 polyclonal antibodies (K1 and K2). The additional, undetermined 95 kDa band detected by the K1 antibody (A) served as an internal control for blot normalization. C) Lentiviral construct. The mouse KRIT1A cDNA (GenBank AY464945) was subcloned into the lentiviral expression vector pCCLsin.PPT.PGK.Wpre finally coding for the full-length KRIT1A protein. D) Western blot analysis with the K2 antibody assessing KRIT1 re-expression levels in KRIT1-transduced MEFs (Lv-KRIT1) as compared to wild type MEFs (KRIT1+/+). KRIT1−/− MEFs, either uninfected (KRIT1−/−) or transduced with a GFP-coding lentiviral construct (Lv-GFP), were used as negative controls. Notice that the distinct KRIT1-transduced cells express either lower (Lv-KRIT1 2/7) or higher (Lv-KRIT1 10/6 and 9/6) levels of KRIT1 than wild type MEFs (KRIT1+/+). Tubulin was used as loading control.
Figure 3
Figure 3. KRIT1 regulates steady-state levels of intracellular ROS.
A–B) Qualitative detection of the steady-state levels of intracellular ROS by fluorescence microscopy. Wild-type (WT), KRIT1−/− (KRIT1−/−) and KRIT1-transduced (Lv-KRIT1 9/6) MEFs grown under standard conditions were analyzed by fluorescence microscopy 20 min after the addition of the cell-permeable redox-sensitive fluorogenic probe DCFH-DA (A) or DHE (B). The images were taken with a fixed short exposure time and a high fluorescence intensity threshold value to avoid saturation, and are representative of several independent experiments. Notice that KRIT1−/− cells (panels b) showed significantly more intense fluorescent signals than WT cells (panels a), indicating that they contained higher levels of ROS. Conversely, ROS levels in KRIT1−/− cells were reduced to near WT levels upon KRIT1 re-expression by lentiviral infection (panels c). Scale bar represents 50 µm. C–H. Quantitative determination of the steady-state levels of intracellular ROS by FACS analysis. Wild-type (WT), KRIT1−/− (K−/−) and three distinct KRIT1−/− cell populations re-expressing KRIT1 at low, medium and high levels, respectively [Lv-KRIT1 2/7 (K2/7), 10/6 (K10/6) and 9/6 (K9/6)], were grown under standard conditions and analyzed by FACS 20 min after the addition of the DCFH-DA (C–F) or DHE (G,H) probes. Representative flow cytometry profiles (C,E,G) and quantitative histograms of the mean fluorescence intensity (M.F.I.) values (D,F,H) of n≥5 independent FACS experiments are shown. M.F.I. values were normalized to spontaneous fluorescence of control cells untreated with the fluorogenic probes (Ctr) and expressed as percentage of KRIT1−/− (K−/−) cells (± SD). *P<0.001 versus KRIT1−/− cells. Notice that KRIT1−/− cells displayed the highest content of intracellular ROS, whereas the re-expression of KRIT1 caused a significant, expression level-dependent decrease in intracellular ROS levels.
Figure 4
Figure 4. KRIT1 modulates the expression levels of the antioxidant protein SOD2.
KRIT1−/− MEFs, either uninfected (K−/−) or GFP-transduced (K−/−GFP), and three distinct KRIT1-transduced MEF populations re-expressing KRIT1 at low, medium and high levels, respectively (K2/7, K10/6 and K9/6), were grown under standard conditions and analyzed by Western blot and RT-qPCR as described in Materials and Methods. A) Western blot analysis of the relative SOD2 and KRIT1 protein expression levels. KRIT1 protein levels in cell extracts were assessed using both the K1 (K1 pAb) and K2 (K1 pAb) antibodies. The additional, undetermined 95 kDa band detected by the K1 antibody (A, panel K1 pAb) served as internal control for blot normalization. B–D) RT-qPCR analysis of SOD2 (B), SOD1 (C) and Cat (D) mRNA expression levels. The amount of each target mRNA expressed in a sample was analyzed in triplicate using appropriate TaqMan® gene expression assays (Roche), and normalized to the amounts of internal normalization control transcripts (18S rRNA and GAPDH). Results are expressed as relative mRNA level units referred to the average value obtained for the KRIT1−/− (K−/−) samples, and represent the mean (± SD) of n≥3 independent RT-qPCR experiments. *P<0.001 versus KRIT1−/− cells. Notice that KRIT1 re-expression in KRIT1−/− cells caused a significant, dose-dependent upregulation of SOD2 expression at both protein and mRNA levels.
Figure 5
Figure 5. KRIT1 regulates FoxO1 expression and activity.
Wild-type (WT), KRIT1−/− MEFs (K−/−) and Lv-KRIT1 MEFs re-expressing KRIT1 at low, medium and high levels, respectively (K2/7, K10/6 and K9/6), were analyzed by RT-qPCR and Western blot as described in Materials and Methods. A) RT-qPCR analysis of FoxO1 mRNA expression levels. Results are expressed as relative mRNA level units referred to the average value obtained for the KRIT1−/− (K−/−) samples, and represent the mean (± SD) of n≥3 independent RT-qPCR experiments. *P<0.001 versus KRIT1−/− cells. Notice that KRIT1 re-expression in KRIT1−/− cells caused a significant, dose-dependent upregulation of FoxO1 mRNA levels. B–D) Western blot analysis of FoxO1 protein expression in confluent KRIT1−/− and Lv-KRIT1 MEFs. Cells were grown to confluence in standard culture conditions, and lysed (B). Alternatively, confluent cells were serum-starved overnight (C) and either left untreated (-FCS) or treated with 10% FCS for 15 min (+FCS) before lysis. In the FoxO1 blots, the upper and lower bands are the phosphorylated and unphosphorylated forms of FoxO1, respectively. (D) To demonstrate that the upward electrophoretic mobility shift of FoxO1 was Akt-dependent, confluent cells were serum-starved overnight and treated with 10% FCS for 15 min (+FCS) either in the absence (-LY) or in the presence (+LY) of the PI3K/Akt pathway inhibitor LY294002. Phospho-Akt levels were determined with an antibody to phospho-serine 473. The undetermined 95 kDa band detected by the K1 antibody and Tubulin served as loading controls. Notice that the expression level of FoxO1 is reduced and the ratio of phosphorylated to unphosphorylated forms of FoxO1 is increased in KRIT1−/− MEFs compared with Lv-KRIT1 MEFs.
Figure 6
Figure 6. siRNA-mediated knockdown of KRIT1 in HUVEC cells results in the downregulation of FoxO1 and SOD2 mRNA expression.
HUVEC cells were transfected with either two distinct KRIT1-specific siRNA (siK655 and siK469) or a negative control siRNA (siNC). 48 hours post-transfection, RNA was isolated and analyzed in triplicate by RT-qPCR using TaqMan® gene expression assays specific for human KRIT1 (A), FoxO1 (B), SOD2 (C), FoxO4 (D), SOD1 (E), and Cat (F) mRNA. 18S rRNA was used as an endogenous control for RT-qPCR normalization. Results are expressed as relative mRNA level units referred to the average value obtained for negative control siRNA-treated samples, and represent the mean (± SD) of n≥3 independent RNAi experiments. *P<0.001 versus siNC. Notice that the knockdown of KRIT1 in HUVEC cells, although incomplete, was sufficient to induce a significant downregulation of FoxO1 and SOD2 mRNA expression levels.
Figure 7
Figure 7. KRIT1 expression facilitates FoxO-mediated cell transition from proliferative growth to quiescence.
A–D) Wild-type (WT), KRIT1−/− (K−/−) and Lv-KRIT1 (K2/7, K10/6 and K9/6) MEFs were grown to confluence and either left untreated at confluence for 2 days (A–C), stimulated to proliferate by replating at subconfluence in 10%FCS-containing medium for 2 hrs (D, pre-conf/10%FCS) or maintained at confluence in serum-free medium for 18 to 20 h to induce cell cycle exit (D, post-confl/0%FCS). A) Western blot analysis of cyclin D1 expression in KRIT1−/− and Lv-KRIT1 MEFs left at confluence for 2 days in complete medium. Tubulin was used as loading control. Notice that cyclin D1 protein levels are significantly higher in KRIT1−/− than Lv-KRIT1 MEFs. B–C) RT-qPCR analysis of cyclin D1 (B) and p27Kip1 (C) mRNA expression levels. Results are expressed as relative mRNA level units referred to the average value obtained for the KRIT1−/− (K−/−) samples, and represent the mean (± SD) of n≥3 independent RT-qPCR experiments. *P<0.001 versus KRIT1−/− cells. Notice that the expression of KRIT1 facilitates the downregulation of cyclin D1 and the upregulation of the cell cycle inhibitor p27Kip1 mRNA levels required for cell transition from proliferative growth to quiescence. D) Western blot analysis of cyclin D1 expression in KRIT1−/− and Lv-KRIT1 MEFs allowed to proliferate (pre-conf/10%FCS) or to exit from the cell cycle (post-confl/0%FCS). Tubulin was used as loading control. Notice that, while KRIT1−/− and Lv-KRIT1 proliferating cultures show similar levels of cyclin D1 and FoxO1, the expression levels of cyclin D1 are significantly reduced in post-confluent/serum-starved Lv-KRIT1 but not KRIT1−/− cultures, and this effect is associated with the upregulation of FoxO1 protein levels/activity. E–F) Equal number of KRIT1−/− (K−/−) and Lv-KRIT1 (K9/6) MEFs were dispensed in 96-well microtiter plates and maintained in complete medium. E) The number of adherent cells was determined at different time periods using the crystal violet staining method. Data are expressed as a percentage of the crystal violet absorbance at the zero-time point, deemed as 100%, and represent the mean (± SD) of the percentage increase of cell numbers from 5 independent experiments. F) Post-confluent (72 hrs) cell cultures were stained with crystal violet and photographed at 40× microscope magnification. Notice the significant differences in cell number (E) and cell density (F) between post-confluent KRIT1−/− and Lv-KRIT1 MEFs.
Figure 8
Figure 8. ROS scavenging overcomes the upregulation of cyclin D1 and the reduced cell capacity to exit from the proliferative cycle caused by KRIT1 loss.
KRIT1−/− (K−/−) and Lv-KRIT1 (K9/6) MEFs were grown to post-confluence either in the absence or presence of the ROS scavenging agent N-acetylcysteine (NAC, 20 mM)). A) Representative flow cytometry profiles of 5 independent FACS analyses of the intracellular ROS levels in untreated (dashed curves) and NAC-treated (solid curves) KRIT1−/− and Lv-KRIT1 MEFs, as detected by the DCFH-DA probe. Notice that the significant differences in ROS levels between untreated KRIT1−/− and Lv-KRIT1 MEFs were almost completely abrogated upon NAC treatment. B) Western blot analysis of cyclin D1, FoxO1 and SOD2 protein expression in untreated and NAC-treated KRIT1−/− and Lv-KRIT1 MEFs. Tubulin was used as loading control. Notice that the NAC-mediated abrogation of the differences in ROS levels between KRIT1−/− and Lv-KRIT1 MEFs correlates with the abrogation of the differences in cyclin D1 but not FoxO1 nor SOD2 levels. C) Cell numbers in untreated and NAC-treated post-confluent KRIT1−/− and Lv-KRIT1 MEFs, as determined at different time periods starting from early confluence using the crystal violet staining method. Notice that the significant differences in cell numbers occurring between untreated KRIT1−/− and Lv-KRIT1 MEFs (dashed lines) are completely abrogated by the NAC treatment (solid lines).
Figure 9
Figure 9. KRIT1 protects cells from oxidative stress-induced DNA damage.
A) Confluent wild-type (WT), KRIT1−/− (K−/−GFP and K−/−), and Lv-KRIT1 (K2/7, K10/6 and K9/6) MEFs were either left untreated (untreated) or treated with 0,5 mM H2O2 for 30 min (H2O2 treated) before DNA extraction. 8-oxo-dG levels were measured by HPLC-EC as described in Materials and Methods. Values are the mean (± SD) of 5 independent assays. *P≤0.001 versus KRIT1−/−. Notice that a modest but significant accumulation of 8-oxo-dG was detected in KRIT1−/− MEFs as compared with KRIT1 re-expressing MEFs, which was further enhanced upon cell treatment with H2O2. B) Western blot analysis of phosphorylated histone γ-H2AX expression levels upon treatment of confluent KRIT1−/− (K−/−GFP and K−/−) and Lv-KRIT1 (K10/6 and K9/6) MEF cells with 0,5 mM H2O2 for 30 min. KRIT1 protein levels in cell extracts were assessed using the K1 antibody (K1 pAb). The additional, undetermined 95 kDa band detected by this antibody served as internal control for blot normalization. Notice that γ-H2AX levels resulted higher in KRIT1−/− than KRIT1 re-expressing MEFs. C) RT-qPCR analysis of Gadd45α mRNA expression levels in confluent KRIT1−/− (K−/−) and Lv-KRIT1 (K2/7, K10/6 and K9/6) MEFs. Notice that the level of Gadd45α mRNA was significantly elevated in KRIT1−/− MEFs as compared with Lv-KRIT1 MEFs.
Figure 10
Figure 10. Krit1 confers resistance to redox-sensitive activation of caspase-3.
Confluent KRIT1−/− (K−/−) and Lv-KRIT1 (K9/6) MEFs were either left untreated (Ctrl) or treated for 60 min with either 0,5 mM H2O2 (H2O2) (A) or 0,5 mM TBHP (TBHP) (B) before protein extraction. The presence of the proteolitic-cleaved, active form of caspase 3 (17 kDa), a hallmark of cell response to apoptotic stimuli, was assessed by Western blot analysis as described in Materials and Methods. Tubulin was used as loading control. Notice that, upon oxidative challenge with either H2O2 or TBHP, the active form of caspase-3 resulted significantly enhanced in KRIT1−/− than KRIT1 re-expressing MEFs.
Figure 11
Figure 11. Krit1 regulates mitochondrial homeostasis.
A) Wild-type (WT), KRIT1−/− (K−/−) and KRIT1-transduced (K9/6) MEFs grown under standard conditions were infected with the adenovirus expressing the mtAEQ chimera. After 36 h of expression cells were measured as described in Material and Methods. Where indicated, the cells were stimulated with 100 µM ATP. The traces shown are representative of the kinetic of mitochondrial Ca2+ responses. B) [Ca2+]m responses is represented as a percentage of the peak value of control cells. C) TMRM staining after 30 minutes loading at 37°C, as described in Materials and Methods. K−/− cells showed a significant lower intensity fluorescent signal than WT and K9/6 MEFs clearly indicating a reduced mitochondrial membrane potential (Δψ). D) Kinetics of tetramethyl rhodamine methyl ester (TMRM) fluorescence of WT, K−/− and K9/6 MEFs. FCCP (carbonyl cyanide p-trifluoromethoxyphenylhydrazone), an uncoupler of oxidative phosphorylation, completely collapses the Δψ. The traces are representative of single cell responses. E) Average variations of TMRM fluorescence of WT, K−/− and K9/6 MEFs treated with FCCP as calculated for six independent experiments and represented as a percentage of the value of WT cells. F) WT, K−/− and K9/6 MEFs were infected with the adenovirus expressing the mtLUC chimera. The traces show mitochondrial ATP concentration ([ATP]m) changes elicited by mitochondrial Ca2+ increase in cells perfused with 100 µM ATP as agonist. mtLuc luminescence data are expressed as a percentage of the initial value. The traces are representative of n = 12 from three independent experiments.

References

    1. Serebriiskii I, Estojak J, Sonoda G, Testa JR, Golemis EA. Association of Krev-1/rap1a with Krit1, a novel ankyrin repeat-containing protein encoded by a gene mapping to 7q21-22. Oncogene. 1997;15:1043–1049. - PubMed
    1. Labauge P, Denier C, Bergametti F, Tournier-Lasserve E. Genetics of cavernous angiomas. Lancet Neurol. 2007;6:237–244. - PubMed
    1. Laberge-le Couteulx S, Jung HH, Labauge P, Houtteville JP, Lescoat C, et al. Truncating mutations in CCM1, encoding KRIT1, cause hereditary cavernous angiomas. Nat Genet. 1999;23:189–193. - PubMed
    1. Sahoo T, Johnson EW, Thomas JW, Kuehl PM, Jones TL, et al. Mutations in the gene encoding KRIT1, a Krev-1/rap1a binding protein, cause cerebral cavernous malformations (CCM1). Hum Mol Genet. 1999;8:2325–2333. - PubMed
    1. Marchuk DA, Srinivasan S, Squire TL, Zawistowski JS. Vascular morphogenesis: tales of two syndromes. Hum Mol Genet. 2003;12 Spec No 1:R97–112. - PubMed

Publication types

MeSH terms