

Influenza infectious dose may explain the high mortality of the second and third wave of 1918-1919 influenza pandemic
- PMID: 20668679
- PMCID: PMC2909907
- DOI: 10.1371/journal.pone.0011655
Influenza infectious dose may explain the high mortality of the second and third wave of 1918-1919 influenza pandemic
Abstract
Background: It is widely accepted that the shift in case-fatality rate between waves during the 1918 influenza pandemic was due to a genetic change in the virus. In animal models, the infectious dose of influenza A virus was associated to the severity of disease which lead us to propose a new hypothesis. We propose that the increase in the case-fatality rate can be explained by the dynamics of disease and by a dose-dependent response mediated by the number of simultaneous contacts a susceptible person has with infectious ones.
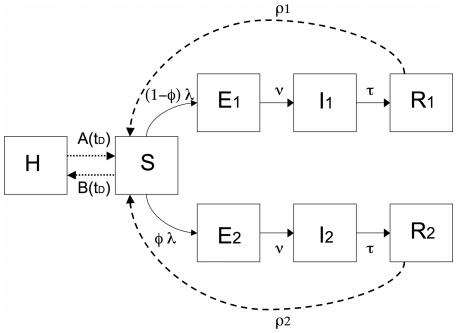
Methods: We used a compartment model with seasonality, waning of immunity and a Holling type II function, to model simultaneous contacts between a susceptible person and infectious ones. In the model, infected persons having mild or severe illness depend both on the proportion of infectious persons in the population and on the level of simultaneous contacts between a susceptible and infectious persons. We further allowed for a high or low rate of waning immunity and volunteer isolation at different times of the epidemic.
Results: In all scenarios, case-fatality rate was low during the first wave (Spring) due to a decrease in the effective reproduction number. The case-fatality rate in the second wave (Autumn) depended on the ratio between the number of severe cases to the number of mild cases since, for each 1000 mild infections only 4 deaths occurred whereas for 1000 severe infections there were 20 deaths. A third wave (late Winter) was dependent on the rate for waning immunity or on the introduction of new susceptible persons in the community. If a group of persons became voluntarily isolated and returned to the community some days latter, new waves occurred. For a fixed number of infected persons the overall case-fatality rate decreased as the number of waves increased. This is explained by the lower proportion of infectious individuals in each wave that prevented an increase in the number of severe infections and thus of the case-fatality rate.
Conclusion: The increase on the proportion of infectious persons as a proxy for the increase of the infectious dose a susceptible person is exposed, as the epidemic develops, can explain the shift in case-fatality rate between waves during the 1918 influenza pandemic.
Conflict of interest statement
Figures
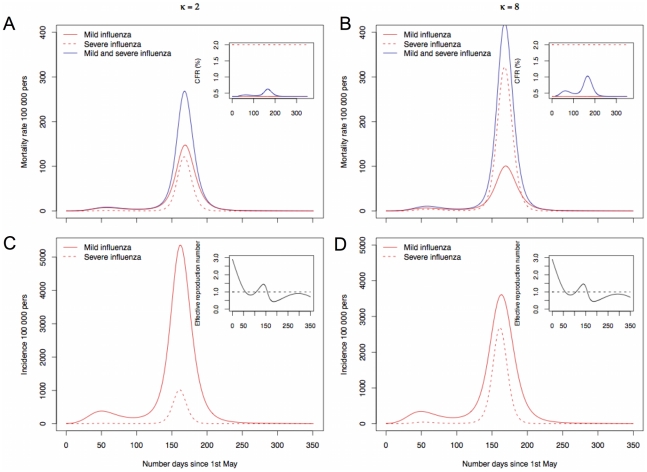
 ) and 2 (
 ). C and D gives the corresponding incidence per 100 000 persons in the population and the effective reproduction rate.
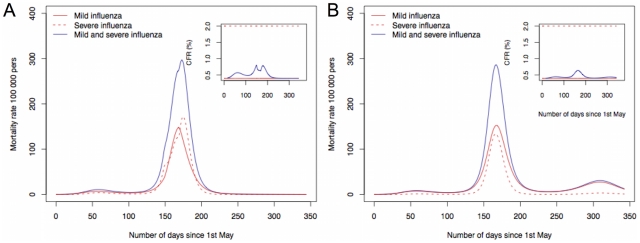
 to
to  and B a faster rate for waning immunity in a scenario where
  .
.
References
Publication types
MeSH terms
LinkOut - more resources
Full Text Sources
Medical
