

Measuring accurate IOPs: Does correction factor help or hurt?
- PMID: 20668723
- PMCID: PMC2909890
- DOI: 10.2147/opth.s11105
Measuring accurate IOPs: Does correction factor help or hurt?
Abstract
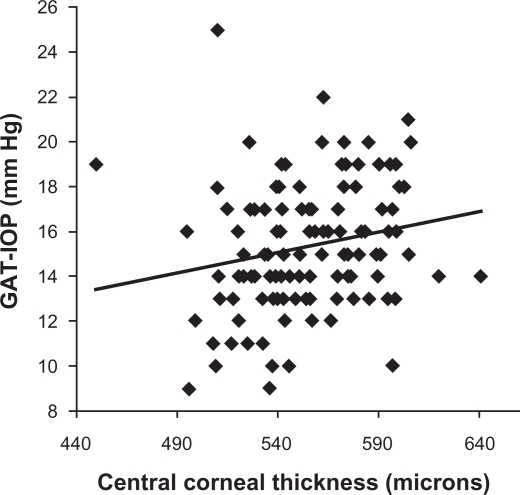
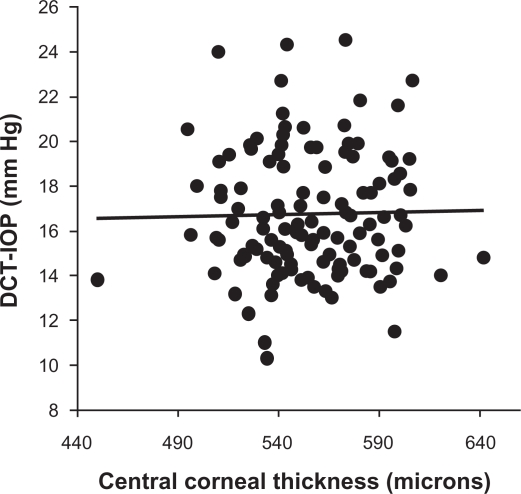
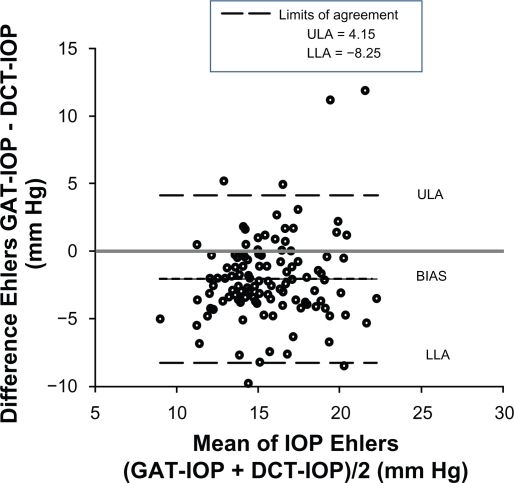
Purpose: To evaluate if using the Ehlers correction factor on the intraocular pressure (IOP) measured using the Goldmann applanation tonometer (GAT) improves its agreement with the PASCAL dynamic contour tonometer (DCT).
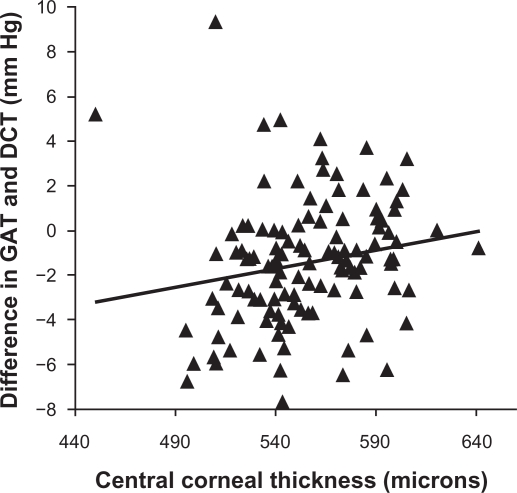
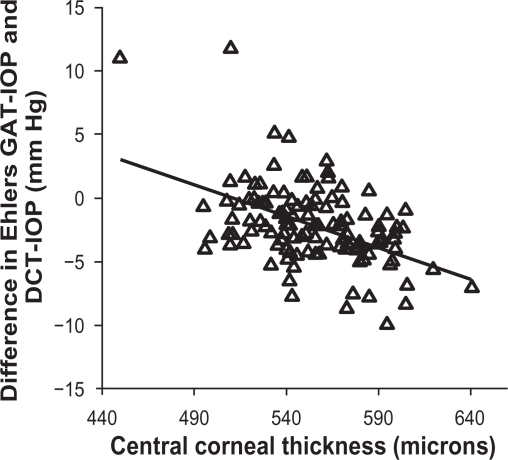
Patients and methods: A total of 120 eyes of 120 individuals were examined. Participants underwent IOP measurement with both the DCT and the GAT and central corneal thickness measurement. The Ehlers correction factor was applied on the GAT IOP measurements to calculate Ehlers-corrected GAT IOP. The agreement between the DCT and GAT, and DCT and Ehlers-corrected GAT IOP was analyzed. The analyses were repeated by stratifying the data by race.
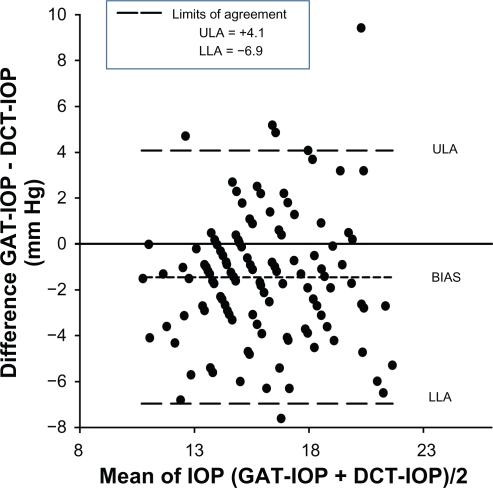
Results: The mean IOP of the GAT, DCT, and the Ehlers-corrected GAT was 15.30, 16.78, and 14.68 mmHg, respectively. The agreement as assessed by Bland-Altman plot for the GAT with the DCT and DCT and Ehlers-corrected GAT IOP was +4.1 to -6.9 and +4.15 to -8.25 mmHg, respectively. The results were similar even when stratifying the data by race.
Conclusion: Using Ehlers correction factor to account for the effect of corneal parameters on the IOP measured by the GAT worsens the agreement with the DCT. This effect remains even when stratifying the data by race.
Keywords: Goldmann applanation tonometer; central corneal thickness; dynamic contour tonometer; intraocular pressure; tonometric correction factors.
Figures
Similar articles
-
Comparison of Goldmann and Pascal tonometry in relation to corneal hysteresis and central corneal thickness in nonglaucomatous eyes.Clin Ophthalmol. 2011;5:1071-7. doi: 10.2147/OPTH.S23086. Epub 2011 Aug 3. Clin Ophthalmol. 2011. PMID: 21847339 Free PMC article.
-
Effect of corneal thickness on dynamic contour, rebound, and goldmann tonometry.Ophthalmology. 2006 Dec;113(12):2156-62. doi: 10.1016/j.ophtha.2006.06.016. Epub 2006 Sep 25. Ophthalmology. 2006. PMID: 16996599 Clinical Trial.
-
Comparisons between Pascal dynamic contour tonometry, the TonoPen, and Goldmann applanation tonometry in patients with glaucoma.Acta Ophthalmol Scand. 2007 May;85(3):272-9. doi: 10.1111/j.1600-0420.2006.00834.x. Acta Ophthalmol Scand. 2007. PMID: 17488456
-
Intraocular pressure measurement precision with the Goldmann applanation, dynamic contour, and ocular response analyzer tonometers.Ophthalmology. 2010 Apr;117(4):730-7. doi: 10.1016/j.ophtha.2009.09.020. Epub 2010 Feb 1. Ophthalmology. 2010. PMID: 20122737 Clinical Trial.
-
Can Corneal Biomechanical Properties Explain Difference in Tonometric Measurement in Normal Eyes?Optom Vis Sci. 2018 Feb;95(2):120-128. doi: 10.1097/OPX.0000000000001175. Optom Vis Sci. 2018. PMID: 29370019
Cited by
-
Rapid and Accurate Pressure Sensing Device for Direct Measurement of Intraocular Pressure.Transl Vis Sci Technol. 2020 Feb 25;9(3):28. doi: 10.1167/tvst.9.3.28. Transl Vis Sci Technol. 2020. PMID: 32742758 Free PMC article.
-
Comparison of Goldmann and Pascal tonometry in relation to corneal hysteresis and central corneal thickness in nonglaucomatous eyes.Clin Ophthalmol. 2011;5:1071-7. doi: 10.2147/OPTH.S23086. Epub 2011 Aug 3. Clin Ophthalmol. 2011. PMID: 21847339 Free PMC article.
-
Age variations in intraocular pressure in a cohort of healthy Austrian school children.Eye (Lond). 2012 Jun;26(6):841-5. doi: 10.1038/eye.2012.54. Epub 2012 Mar 23. Eye (Lond). 2012. PMID: 22441024 Free PMC article.
References
-
- Ehlers N, Bramsen T, Sperling S. Applanation tonometry and central corneal thickness. Acta Ophthalmol (Copenh) 1975;53(1):34–43. - PubMed
-
- Herdener S, Pache M, Lautebach S, Funk J. Dynamic contour tonometry (DCT) versus Goldmann applanation tonometry (GAT) – a comparison of agreement and reproducibility. Graefes Arch Clin Exp Ophthalmol. 2007;245(7):1027–1030. - PubMed
-
- Kaufmann C, Bachmann LM, Thiel MA. Comparison of dynamic contour tonometry with Goldmann applanation tonometry. Invest Ophthalmol Vis Sci. 2004;45(9):3118–3121. - PubMed
-
- Sullivan-Mee M, Gerhardt G, Halverson KD, Qualls C. Repeatability and reproducibility for intraocular pressure measurement by dynamic contour, ocular response analyzer, and Goldmann applanation tonometry. J Glaucoma. 2009;18(9):666–673. - PubMed
LinkOut - more resources
Full Text Sources
