

Environment influences on the aromatic character of nucleobases and amino acids
- PMID: 20668897
- PMCID: PMC2949574
- DOI: 10.1007/s00894-010-0806-5
Environment influences on the aromatic character of nucleobases and amino acids
Abstract
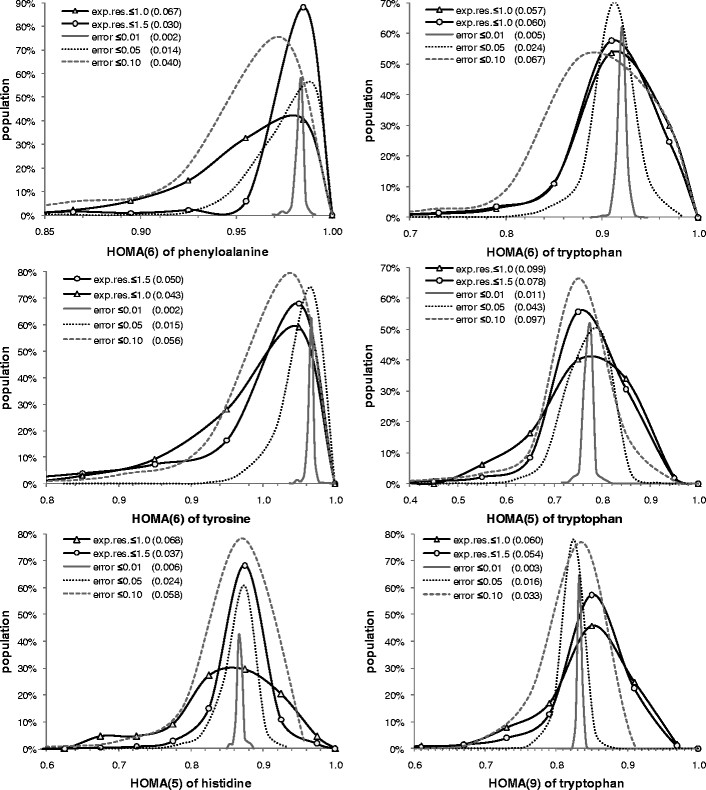
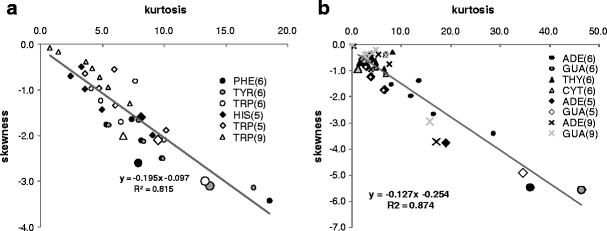
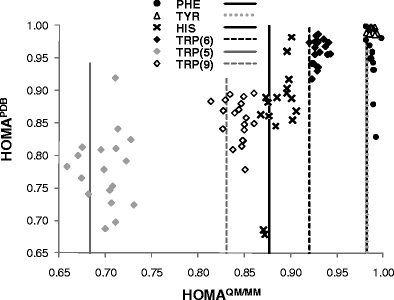
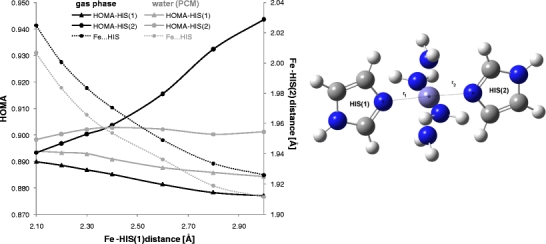
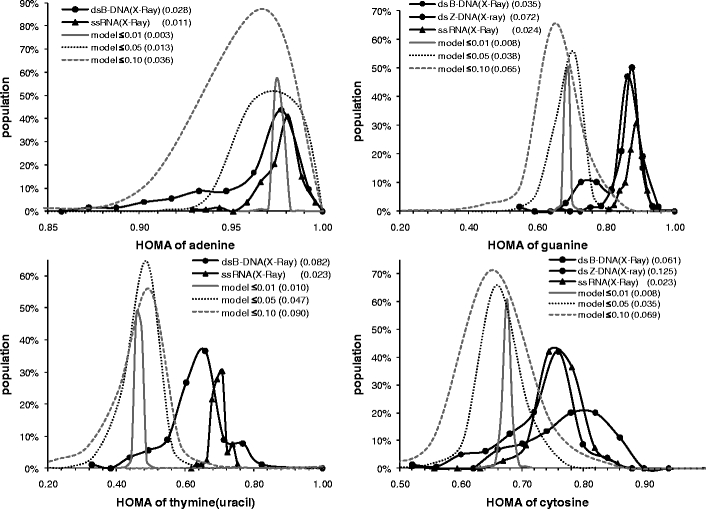
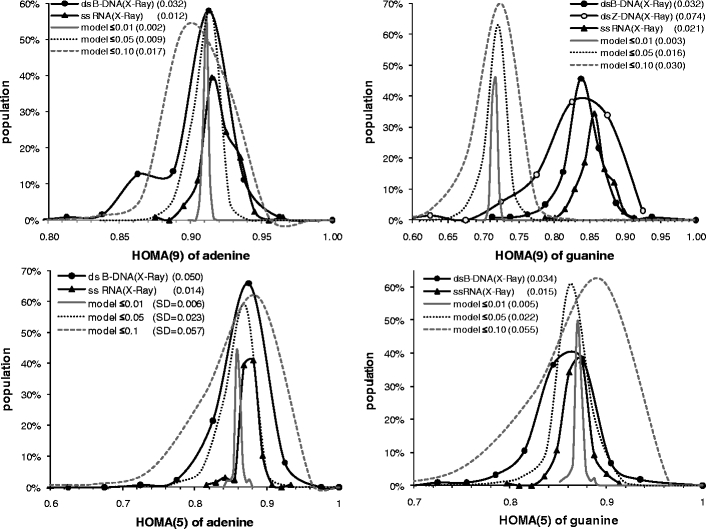
Geometric (HOMA) and magnetic (NICS) indices of aromaticity were estimated for aromatic rings of amino acids and nucleobases. Cartesian coordinates were taken directly either from PDB files deposited in public databases at the finest resolution available (≤ 1.5 Å), or from structures resulting from full gradient geometry optimization in a hybrid QM/MM approach. Significant environmental effects imposing alterations of HOMA values were noted for all aromatic rings analysed. Furthermore, even extra fine resolution (≤ 1.0 Å) is not sufficient for direct estimation of HOMA values based on Cartesian coordinates provided by PDB files. The values of mean bond errors seem to be much higher than the 0.05 Å often reported for PDB files. The use of quantum chemistry geometry optimization is strongly advised; even a simple QM/MM model comprising only the aromatic substructure within the QM region and the rest of biomolecule treated classically within the MM framework proved to be a promising means of describing aromaticity inside native environments. According to the results presented, three consequences of the interaction with the environment can be observed that induce changes in structural and magnetic indices of aromaticity. First, broad ranges of HOMA or NICS values are usually obtained for different conformations of nearest neighborhood. Next, these values and their means can differ significantly from those characterising isolated monomers. The most significant increase in aromaticities is expected for the six-membered rings of guanine, thymine and cytosine. The same trend was also noticed for all amino acids inside proteins but this effect was much smaller, reaching the highest value for the five-membered ring of tryptophan. Explicit water solutions impose similar changes on HOMA and NICS distributions. Thus, environment effects of protein, DNA and even explicit water molecules are non-negligible sources of aromaticity changes appearing in the rings of nucleobases and aromatic amino acids residues.
Figures


Similar articles
-
Quantification of thermal ring flexibilities of aromatic and heteroaromatic compounds.J Mol Model. 2011 Sep;17(9):2249-57. doi: 10.1007/s00894-010-0901-7. Epub 2010 Dec 1. J Mol Model. 2011. PMID: 21120555 Free PMC article.
-
A post-SCF complete basis set study on the recognition patterns of uracil and cytosine by aromatic and pi-aromatic stacking interactions with amino acid residues.Phys Chem Chem Phys. 2008 May 21;10(19):2636-45. doi: 10.1039/b718394a. Epub 2008 Mar 14. Phys Chem Chem Phys. 2008. PMID: 18464978
-
Role of electron density and magnetic couplings on the nucleus-independent chemical shift (NICS) profiles of [2.2]paracyclophane and related species.J Org Chem. 2006 Feb 17;71(4):1700-2. doi: 10.1021/jo052095z. J Org Chem. 2006. PMID: 16468827
-
On Aromaticity of the Aromatic α-Amino Acids and Tuning of the NICS Indices to Find the Aromaticity Order.J Phys Chem A. 2022 Jun 9;126(22):3433-3444. doi: 10.1021/acs.jpca.2c00346. Epub 2022 May 26. J Phys Chem A. 2022. PMID: 35617165 Free PMC article.
-
Nucleobases as supramolecular motifs.Chem Soc Rev. 2005 Jan;34(1):9-21. doi: 10.1039/b304608g. Epub 2004 Dec 6. Chem Soc Rev. 2005. PMID: 15643486 Review.
Cited by
-
The Avoidance of Purine Stretches by Cancer Mutations.Int J Mol Sci. 2024 Oct 15;25(20):11050. doi: 10.3390/ijms252011050. Int J Mol Sci. 2024. PMID: 39456831 Free PMC article.
-
Interactions of Nedaplatin with Nucleobases and Purine Alkaloids: Their Role in Cancer Therapy.Biomedicines. 2025 Jun 25;13(7):1551. doi: 10.3390/biomedicines13071551. Biomedicines. 2025. PMID: 40722626 Free PMC article.
-
Pressure-imposed changes of benzoic acid crystals.J Mol Model. 2015 Apr;21(4):83. doi: 10.1007/s00894-015-2635-z. Epub 2015 Mar 13. J Mol Model. 2015. PMID: 25764324 Free PMC article.
-
Effects of Different Drying Methods on Amino Acid Metabolite Content and Quality of Ophiocordyceps sinensis by LC-MS/MS Combined with Multivariate Statistical Methods.Metabolites. 2024 Aug 18;14(8):459. doi: 10.3390/metabo14080459. Metabolites. 2024. PMID: 39195555 Free PMC article.
-
Geometric consequences of electron delocalization for adenine tautomers in aqueous solution.J Mol Model. 2014 Jun;20(6):2234. doi: 10.1007/s00894-014-2234-4. Epub 2014 May 15. J Mol Model. 2014. PMID: 24842324 Free PMC article.
References
-
- Minkin VI, Glukhovtsev MN, Simkin BYA. Aromaticity and antiaromaticity electronic and structural aspects. New York: Wiley; 1994.
-
- Cyrański MK, Schleyer PVR, Krygowski TM, Jao H, Hohlneicher G. Tetrahedron. 2003;59:1657–1665. doi: 10.1016/S0040-4020(03)00137-6. - DOI
-
- Bird CW. Tetrahedron. 1985;41:1409–1414. doi: 10.1016/S0040-4020(01)96543-3. - DOI
-
- Krygowski TM. J Chem Inf Comput Sci. 1993;33:70–78.
Publication types
MeSH terms
Substances
LinkOut - more resources
Full Text Sources
