

Oligomerization state and supramolecular structure of the HIV-1 Vpu protein transmembrane segment in phospholipid bilayers
- PMID: 20669237
- PMCID: PMC2998723
- DOI: 10.1002/pro.474
Oligomerization state and supramolecular structure of the HIV-1 Vpu protein transmembrane segment in phospholipid bilayers
Abstract
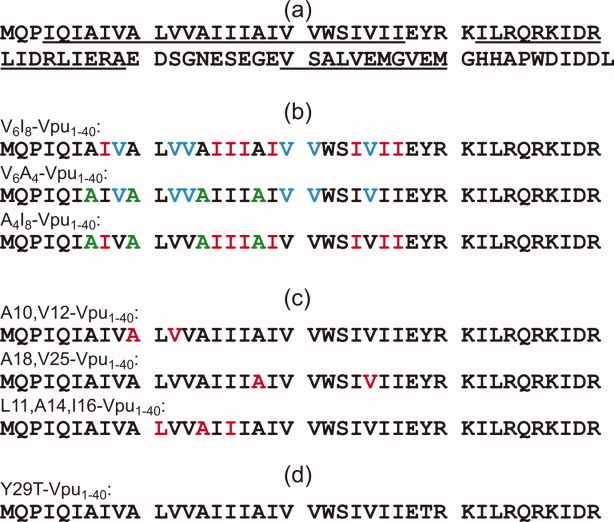
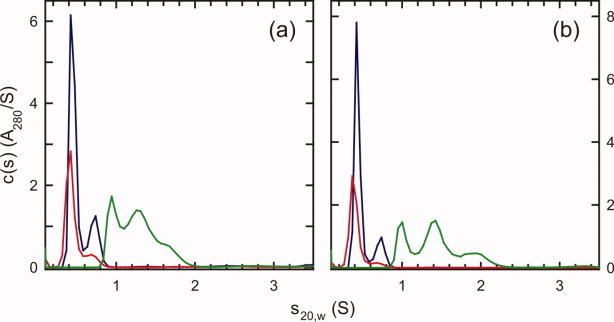
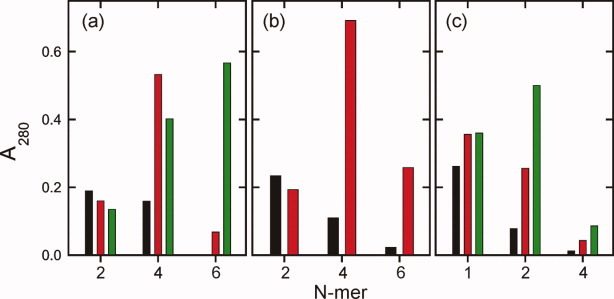
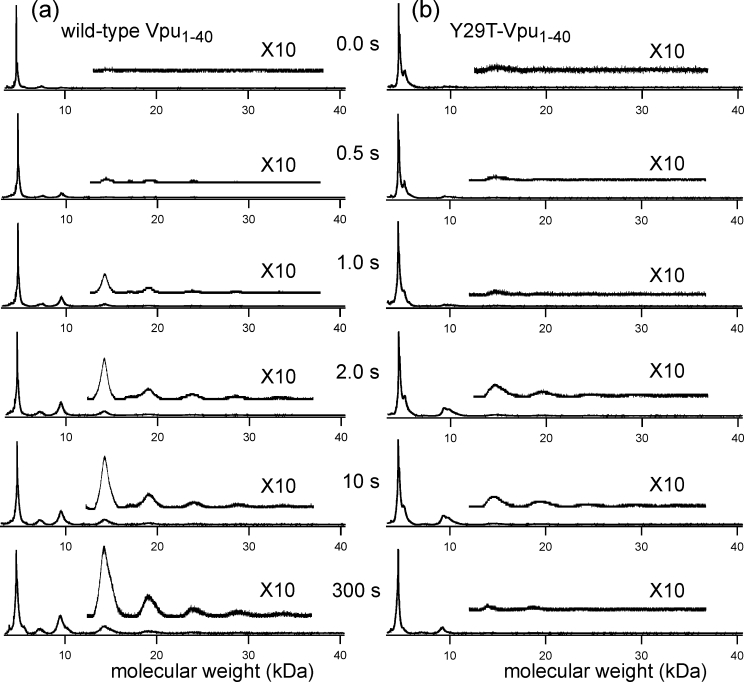
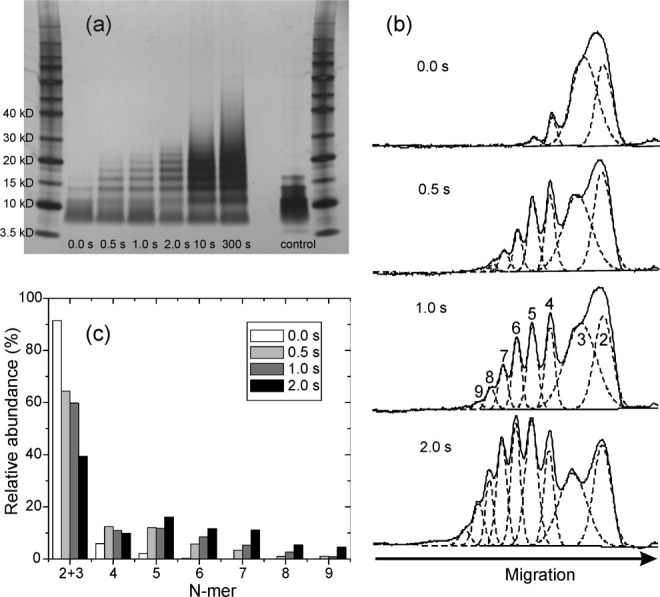
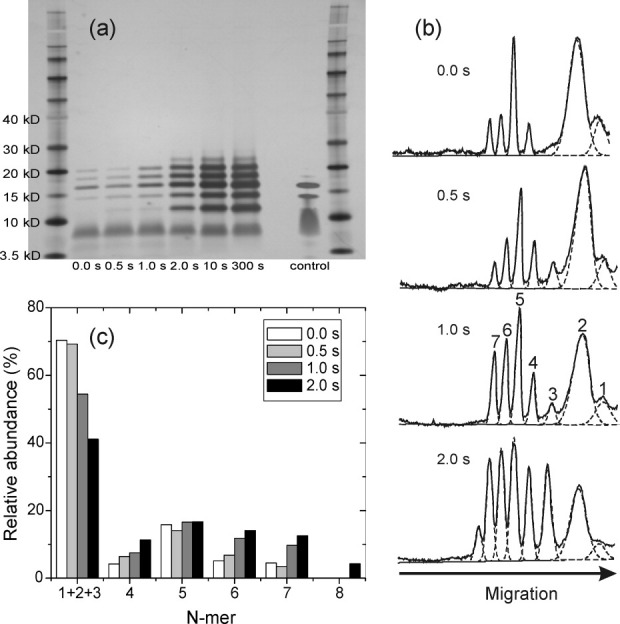
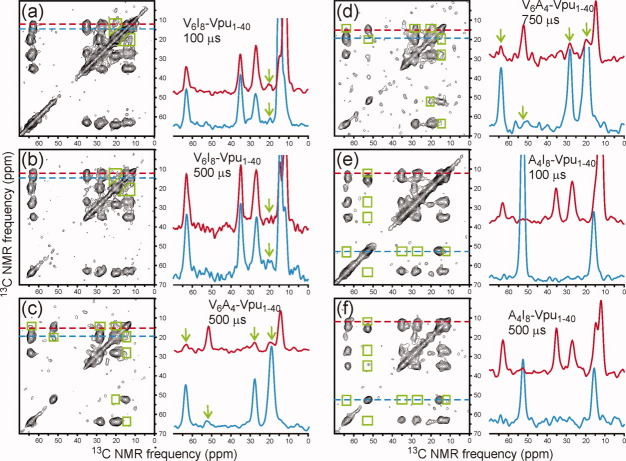
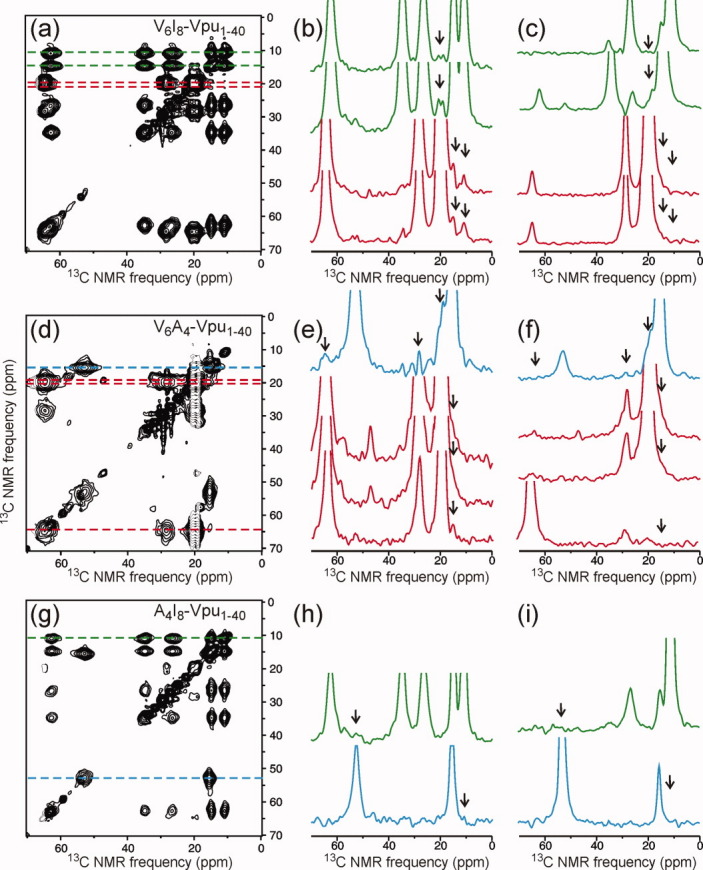
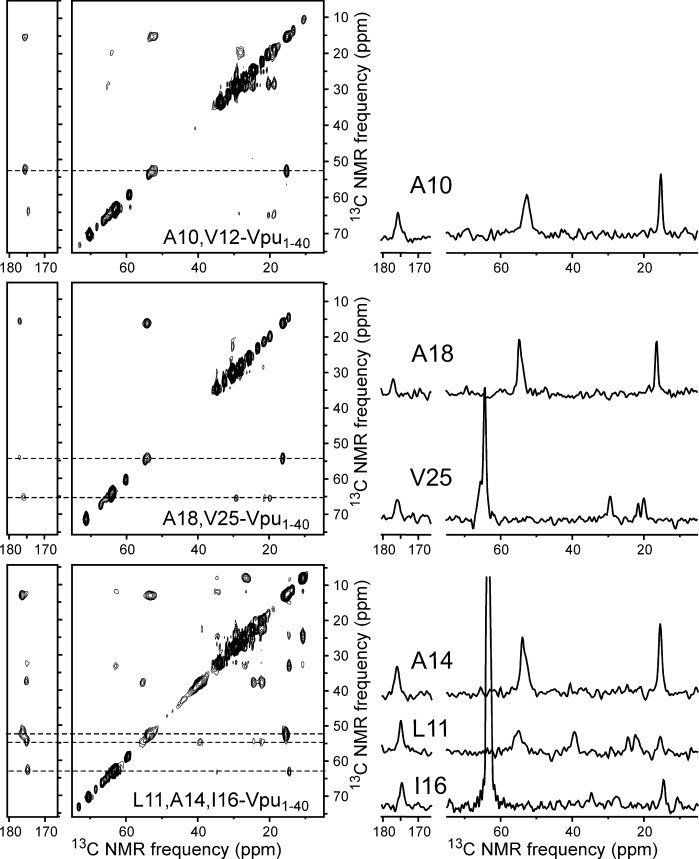
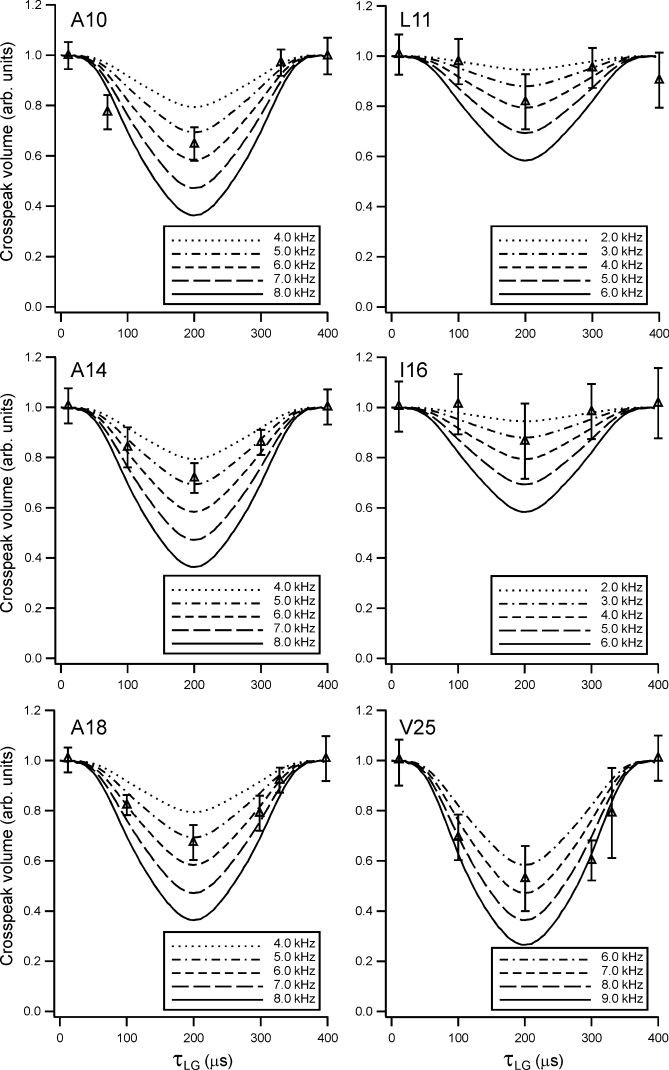
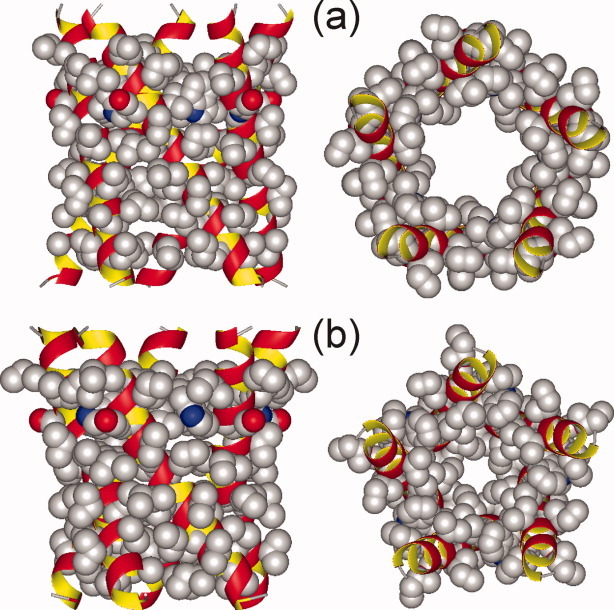
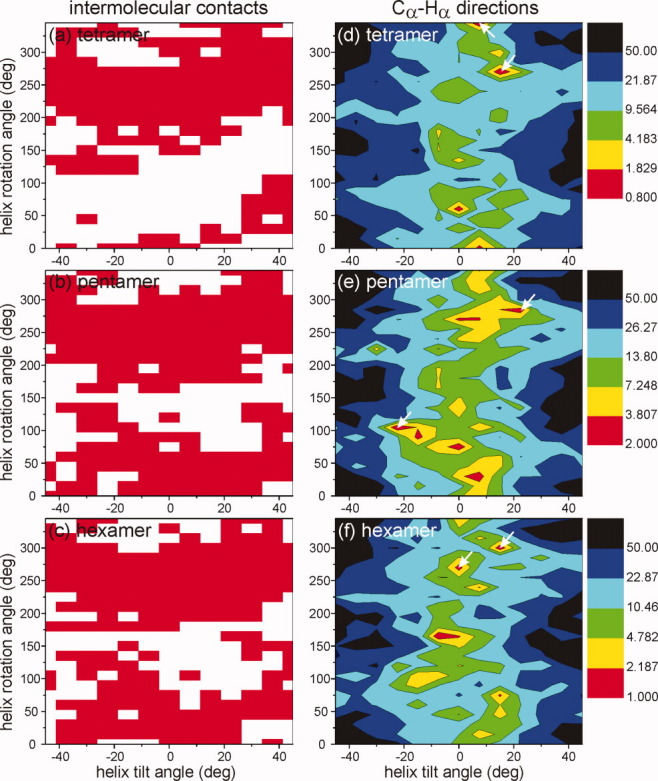
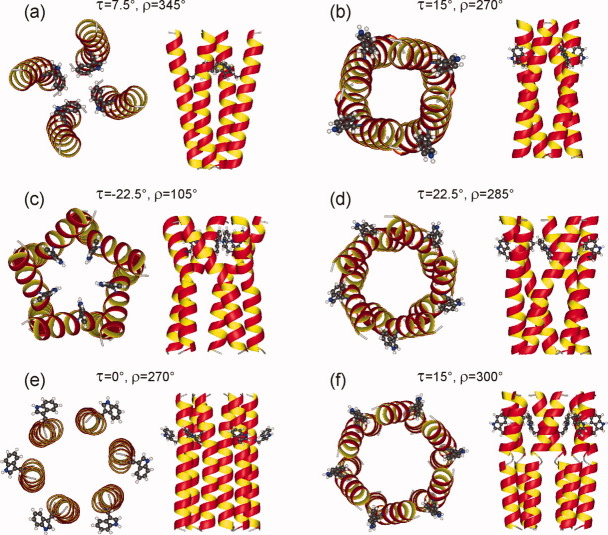
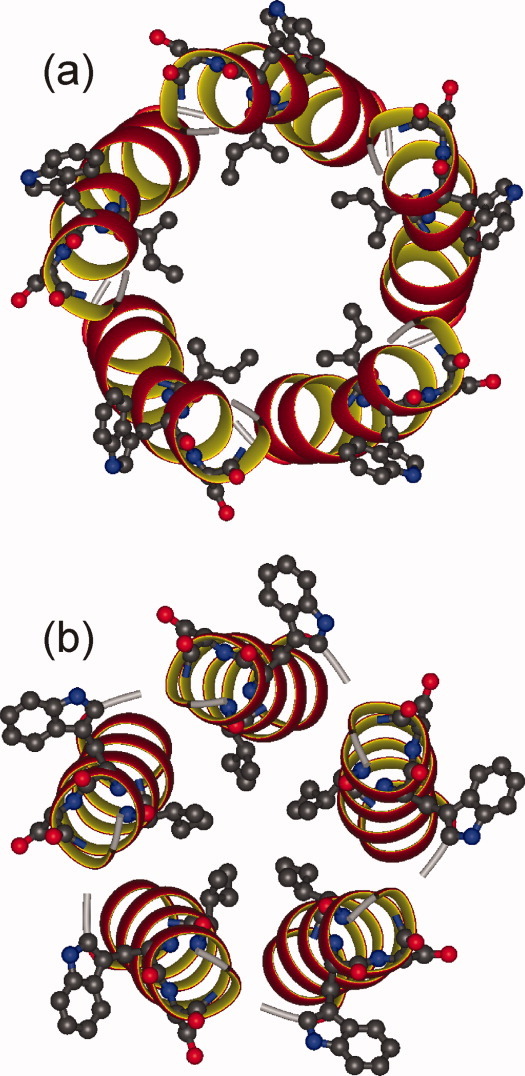
HIV-1 Vpu is an 81-residue protein with a single N-terminal transmembrane (TM) helical segment that is involved in the release of new virions from host cell membranes. Vpu and its TM segment form ion channels in phospholipid bilayers, presumably by oligomerization of TM helices into a pore-like structure. We describe measurements that provide new constraints on the oligomerization state and supramolecular structure of residues 1-40 of Vpu (Vpu(1-40)), including analytical ultracentrifugation measurements to investigate oligomerization in detergent micelles, photo-induced crosslinking experiments to investigate oligomerization in bilayers, and solid-state nuclear magnetic resonance measurements to obtain constraints on intermolecular contacts between and orientations of TM helices in bilayers. From these data, we develop molecular models for Vpu TM oligomers. The data indicate that a variety of oligomers coexist in phospholipid bilayers, so that a unique supramolecular structure can not be defined. Nonetheless, since oligomers of various sizes have similar intermolecular contacts and orientations, molecular models developed from our data are most likely representative of Vpu TM oligomers that exist in host cell membranes.
Figures
Similar articles
-
HIV-1 Vpu protein antagonizes innate restriction factor BST-2 via lipid-embedded helix-helix interactions.J Biol Chem. 2012 Jan 2;287(1):58-67. doi: 10.1074/jbc.M111.296772. Epub 2011 Nov 9. J Biol Chem. 2012. PMID: 22072710 Free PMC article.
-
Biophysical characterization of Vpu from HIV-1 suggests a channel-pore dualism.Proteins. 2008 Mar;70(4):1488-97. doi: 10.1002/prot.21642. Proteins. 2008. PMID: 17910056 Free PMC article.
-
Three-dimensional structure of the transmembrane domain of Vpu from HIV-1 in aligned phospholipid bicelles.Biophys J. 2006 Oct 15;91(8):3032-42. doi: 10.1529/biophysj.106.087106. Epub 2006 Jul 21. Biophys J. 2006. PMID: 16861273 Free PMC article.
-
Structure-function correlates of Vpu, a membrane protein of HIV-1.FEBS Lett. 2003 Sep 18;552(1):47-53. doi: 10.1016/s0014-5793(03)00849-4. FEBS Lett. 2003. PMID: 12972151 Review.
-
Comparative NMR studies demonstrate profound differences between two viroporins: p7 of HCV and Vpu of HIV-1.Biochim Biophys Acta. 2011 Feb;1808(2):554-60. doi: 10.1016/j.bbamem.2010.08.005. Epub 2010 Aug 18. Biochim Biophys Acta. 2011. PMID: 20727848 Free PMC article. Review.
Cited by
-
Characterising protein/detergent complexes by triple-detection size-exclusion chromatography.Biol Proced Online. 2016 Feb 15;18:4. doi: 10.1186/s12575-015-0031-9. eCollection 2016. Biol Proced Online. 2016. PMID: 26880869 Free PMC article.
-
Endocytic activity of HIV-1 Vpu: Phosphoserine-dependent interactions with clathrin adaptors.Traffic. 2017 Aug;18(8):545-561. doi: 10.1111/tra.12495. Epub 2017 Jun 27. Traffic. 2017. PMID: 28504462 Free PMC article.
-
Highly versatile small virus-encoded proteins in cellular membranes: A structural perspective on how proteins' inherent conformational plasticity couples with host membranes' properties to control cellular processes.J Struct Biol X. 2024 Dec 11;11:100117. doi: 10.1016/j.yjsbx.2024.100117. eCollection 2025 Jun. J Struct Biol X. 2024. PMID: 39802090 Free PMC article.
-
Differences in Oligomerization of the SARS-CoV-2 Envelope Protein, Poliovirus VP4, and HIV Vpu.Biochemistry. 2024 Feb 6;63(3):241-250. doi: 10.1021/acs.biochem.3c00437. Epub 2024 Jan 12. Biochemistry. 2024. PMID: 38216552 Free PMC article.
-
Structure and drug binding of the SARS-CoV-2 envelope protein transmembrane domain in lipid bilayers.Nat Struct Mol Biol. 2020 Dec;27(12):1202-1208. doi: 10.1038/s41594-020-00536-8. Epub 2020 Nov 11. Nat Struct Mol Biol. 2020. PMID: 33177698 Free PMC article.
References
-
- Strebel K, Klimkait T, Martin MA. A novel gene of HIV-1, Vpu, and its 16-kilodalton product. Science. 1988;241:1221–1223. - PubMed
-
- Margottin F, Bour SP, Durand H, Selig L, Benichou S, Richard V, Thomas D, Strebel K, Benarous R. A novel human WD protein, h-βTrCP, that interacts with HIV-1 Vpu connects CD4 to the ER degradation pathway through an F-box motif. Mol Cell. 1998;1:565–574. - PubMed
-
- Margottin F, Benichou S, Durand H, Richard V, Liu LX, Gomas E, Benarous R. Interaction between the cytoplasmic domains of HIV-1 Vpu and CD4: role of Vpu residues involved in CD4 interaction and in vitro CD4 degradation. Virology. 1996;223:381–386. - PubMed
Publication types
MeSH terms
Substances
Grants and funding
LinkOut - more resources
Full Text Sources
