. 2010 Jul 29;67(2):280-93.
doi: 10.1016/j.neuron.2010.06.020.

NMDA receptor contributions to visual contrast coding

Affiliations

NMDA receptor contributions to visual contrast coding

Michael B Manookin et al. Neuron. .

Abstract

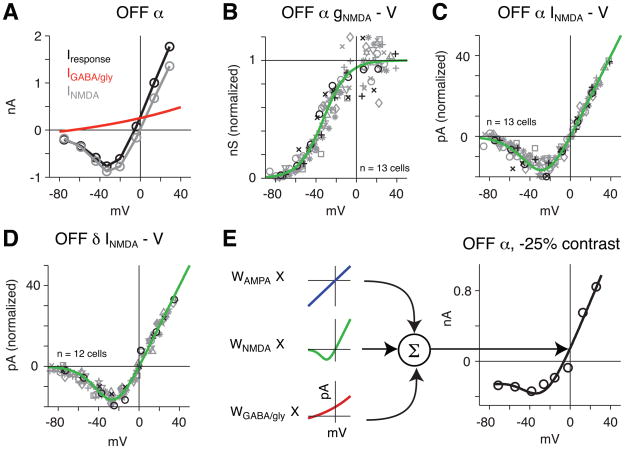
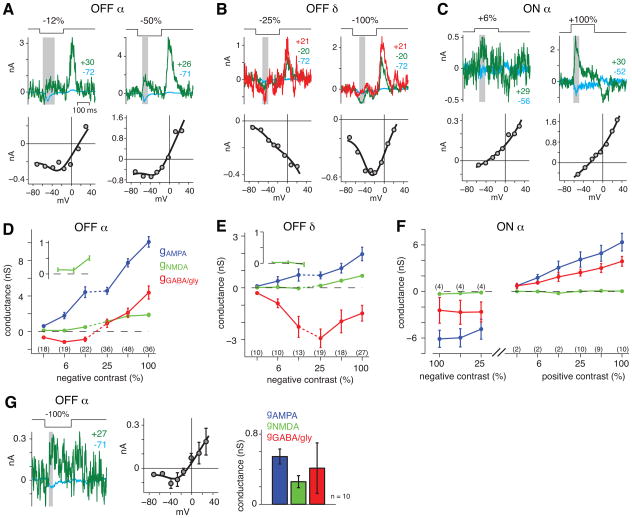
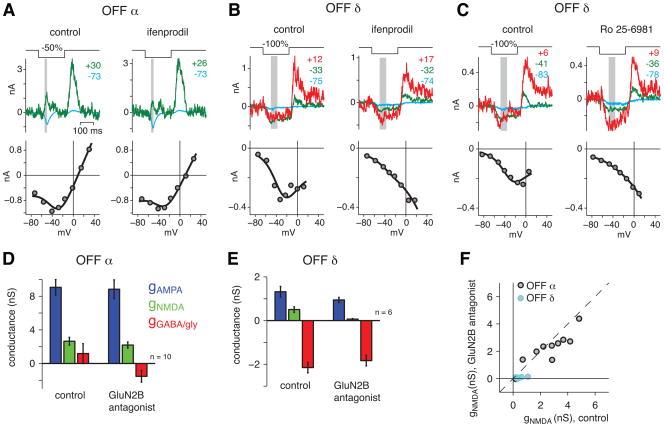
In the retina, it is not well understood how visual processing depends on AMPA- and NMDA-type glutamate receptors. Here we investigated how these receptors contribute to contrast coding in identified guinea pig ganglion cell types in vitro. NMDA-mediated responses were negligible in ON alpha cells but substantial in OFF alpha and delta cells. OFF delta cell NMDA receptors were composed of GluN2B subunits. Using a novel deconvolution method, we determined the individual contributions of AMPA, NMDA, and inhibitory currents to light responses of each cell type. OFF alpha and delta cells used NMDA receptors for encoding either the full contrast range (alpha), including near-threshold responses, or only a high range (delta). However, contrast sensitivity depended substantially on NMDA receptors only in OFF alpha cells. NMDA receptors contribute to visual contrast coding in a cell-type-specific manner. Certain cell types generate excitatory responses using primarily AMPA receptors or disinhibition.


Figures

Figure 1
Figure 1. Differential NMDA receptor expression across ganglion cell types
A. Puffed NMDA application generated a response in OFF α cells (top) that persisted in the presence of ifenprodil (10 μM), which blocks NMDARs composed of the GluN2B (NR2B) subunit (bottom). Here and elsewere, Vholds (Vh;in mV) for inset traces are indicated by color. Gray strip shows the time window used to generate the I-V plot. B. NMDA response in an OFF δ cell (top) was suppressed by ifenprodil (bottom). C. NMDA response in an ON α cell (top) was suppressed by ifenprodil (bottom). The response represents the largest measured among ON α cells and required a relatively long puff duration (~40 ms, compared to ~5–20 ms in most other cases). D. NMDA currents at Vhold = −40 mV (± 5 mV; INMDA, −40 mV) for various cell populations in guinea pig or mouse. Each symbol represents a cell. For guinea pig cells, Cd2+ was used in some cases to block synaptic transmission (gray symbols). In all other cases, isradipine and synaptic blockers were used (see Results). E. In guinea pig, ifenprodil suppressed INMDA, −40 mV for OFF δ cells (circles) and ON α cells (squares), but not OFF α cells (triangles). F. Example OFF δ cell where block of NMDA puff response by ifenprodil recovered after washing away the drug (Vhold = −40 mV).
Figure 2
Figure 2. Generating the inhibitory receptor basis functions
A. An OFF α cell was stimulated with a 50% negative contrast flash in the presence of an NMDAR antagonist (D-AP5, 100 μM). Following the excitatory ‘OFF’ response to the spot, there was an inhibitory ‘ON’ response to the termination of the spot. The ‘ON’ response measured in the time window indicated by the gray strip was used to generate the I-V plot in B (Iresponse). B. The I-V plot for the response in A was separated into two components. A line fitted to the first four points (cyan) was used to estimate the current at ECl (−67 mV). This current was modeled as a decreased excitatory conductance (blue line, IAMPA). Subtracting IAMPA from Iresponse yielded an estimate of the inhibitory current (IGABA/gly, gray symbols). C. The inhibitory current (IGABA/gly) was converted to conductance (gGABA/gly) by multiplying by the driving force (Vhold ECl), excluding data where Vhold was within 5 mV of ECl. Gray symbols show ‘ON’ response to the termination of a dark spot, whereas green symbols show the ‘ON’ response to the onset of a bright spot. Plotted are 14 measurements from 11 cells (each cell is a different symbol/color combination). Red line shows a fitted conductance (see Experimental Procedures). D. Measurements and fits from C. were converted to currents by dividing by the driving force at each Vhold. The fit in the I-V plot represents the GABA/glycine receptor basis function for OFF α cells. E. Same as D. for OFF δ cells (n = eight conditions in seven cells). F. Same as D. for ON α cells (n = four cells).
Figure 3
Figure 3. Generating the NMDAR basis functions
A. NMDA was puffed onto an OFF α cell at several Vholds (see Figure 1). From the puff-evoked response (Iresponse) a putative inhibitory current (IGABA/gly) was subtracted to generate the NMDA current which reversed at Ecation (INMDA). B. The INMDA was converted to conductance (gNMDA) by multiplying by the driving force (Vhold Ecation), excluding data where Vhold was within 5 mV of Ecation. Green line shows a fitted conductance (see Experimental Procedures). Other conventions are the same as for Figure 2C. C. Measurements and fits from B. were converted to currents by dividing by the driving force. The fit in the I-V plot represents the NMDAR basis function for OFF α cells. D. Same as C. for OFF δ cells. E. The basic fitting procedure for modeling light-evoked responses. The I-V plot for the response to a −25% contrast spot in an OFF α cell was modeled (black line) as the weighted sum of the underlying AMPA, NMDA and inhibitory (GABA/gly) receptor basis functions.
Figure 4
Figure 4. The NMDAR contribution to contrast coding differs between cell types
A. Responses and I-V plots for 200-ms pulses of low or high contrast in an OFF α cell. Traces at two Vholds are shown (in mV, indicated above the traces). The fitted line was J-shaped in both cases, indicating an NMDAR contribution to the response. B. Same format as A. for an OFF δ cell. A U-shaped function at −100% contrast reflects an NMDAR contribution. C. Same format as A. for an ON α cell. Fitted functions are relatively linear at both low and high contrast, indicating a weak NMDAR contribution. D. Fitted conductances as a function of contrast for OFF α cells. The stimulus size was usually 0.4-mm dia. for low contrasts (3–12%) and 0.2-mm dia. for high contrasts (25–100%). Error bars indicate SEM across cells. The number of cells recorded at each contrast is indicated below the symbols. Inset shows the NMDAR conductance at the lowest three contrasts. E. Same format as D. for OFF δ cells. F. Same format as D. for ON α cells. The stimulus was either negative or positive contrast, and spot diameter was always 0.5-mm. G. OFF α cell response to a 25 x 25 μm square at high contrast (−100%) showed a J-shaped relationship in the I-V plot (error bars indicate SEM across 10 repeats in one cell). The bar graph shows a significant AMPAR and NMDAR conductance across cells (error bars indicated SEM across 10 cells).
Figure 5
Figure 5. The NMDA component of the fitted response is blocked by D-AP-5
A. Response traces and I-V plots for an OFF α cell under control conditions and in the presence of D-AP-5 (100 μM). The I-V plot becomes more linear in the presence of D-AP-5. B. Contrast response functions for the three fitted conductances. The NMDA component of the fit was suppressed to near zero values in the presence of D-AP- 5. The number of cells at each contrast is indicated below the points in the D-AP-5 condition. C. Same format as A. for an OFF δ cell. In the presence of D-AP-5, the U-shaped I-V relationship changed to a negative linear slope, indicating the suppression of a baseline inhibitory conductance (disinhibition). D. Same format as B. for OFF δ cells.
Figure 6
Figure 6. The NMDAR component of the fitted response in OFF δ cells is blocked by GluN2B antagonists
A. Response traces and I-V plots for an OFF α cell under control conditions and in the presence of the GluN2B antagonist ifenprodil (10 μM). The I-V plot remained J-shaped in both conditions. B. Same format as A. for an OFF δ cell. In the presence of ifenprodil, the U-shaped I-V relationship changed to a negative linear relationship, indicating the suppression of a baseline inhibitory conductance (disinhibition). C. Same format as B. for the GluN2B antagonist Ro 25-6981 (5 μM). D. Bar graphs indicate the fitted conductances for OFF α cells under control conditions and in the presence of GluN2B antagonists (ifenprodil or Ro-25-6981). The stimulus was −50% contrast. Error bars indicate the SEM across cells. E. Same format as C. for OFF δ cells. The stimulus was −100% contrast. The NMDAR conductance was suppressed by the antagonists. F. The fitted NMDAR conductance for each cell is plotted for control versus antagonist conditions.
Figure 7
Figure 7. Blocking NMDA receptors suppresses contrast sensitivity of the firing response in OFF α cells but not in OFF δ cells
A. Loose-patch recordings of cells in the control group and MK-801 group with pipettes filled with the extracellular Ames medium (top). The contrast-response function of the firing response in the two groups was similar (bottom). B. Same as A. for intracellular recording with control pipette solution or solution with MK-801 added. Inset, The difference curve (extracellular intracellular firing rate) shows that MK-801 suppressed firing over most of the contrast range. C. Depolarizing current evoked similar firing responses in both cell groups. D. Average subthreshold Vm showed that the initial depolarization in response to contrast steps was suppressed by MK-801. Spikes were removed by linear interpolation before averaging (Demb et al., 1999). E.-H. Same as A.-D. for OFF δ cells. Responses were only weakly affected by MK-801.
Figure 8
Figure 8. Three cell types show different contributions of NMDAR conductances to the contrast response
Three ganglion cell (GC) types encode bipolar cell (BC) glutamate release using distinct patterns of ionotropic glutamate receptor expression and stimulation. Weak expression is indicated by the gray type. Contributions to low and high contrast are indicated by thin or thick arrows.

References

    1. Aizenman E, Frosch MP, Lipton SA. Responses mediated by excitatory amino acid receptors in solitary retinal ganglion cells from rat. J Physiol. 1988;396:75–91. - PMC - PubMed
    1. Ascher P, Nowak L. The role of divalent cations in the N-methyl-D-aspartate responses of mouse central neurones in culture. J Physiol. 1988;399:247–266. - PMC - PubMed
    1. Beaudoin DL, Manookin MB, Demb JB. Distinct expressions of contrast gain control in parallel synaptic pathways converging on a retinal ganglion cell. J Physiol. 2008;586:5487–5502. - PMC - PubMed
    1. Berntson A, Taylor WR. Response characteristics and receptive field widths of on-bipolar cells in the mouse retina. J Physiol. 2000;524(Pt 3):879–889. - PMC - PubMed
    1. Berretta N, Jones RS. Tonic facilitation of glutamate release by presynaptic N-methyl-D-aspartate autoreceptors in the entorhinal cortex. Neuroscience. 1996;75:339–344. - PubMed

Publication types

MeSH terms

LinkOut - more resources