. 2010 Jul 29;67(2):308-20.
doi: 10.1016/j.neuron.2010.06.019.

Oscillations and filtering networks support flexible routing of information

Affiliations

Oscillations and filtering networks support flexible routing of information

Thomas Akam et al. Neuron. .

Abstract

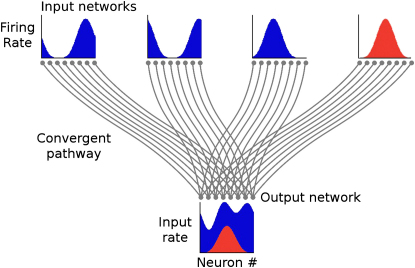
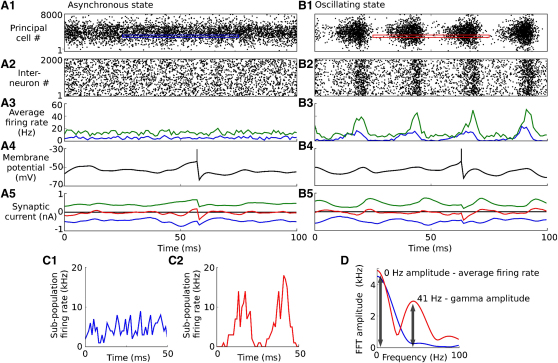
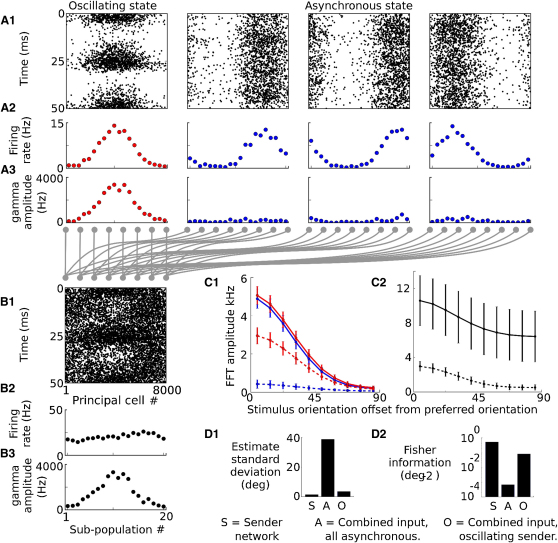
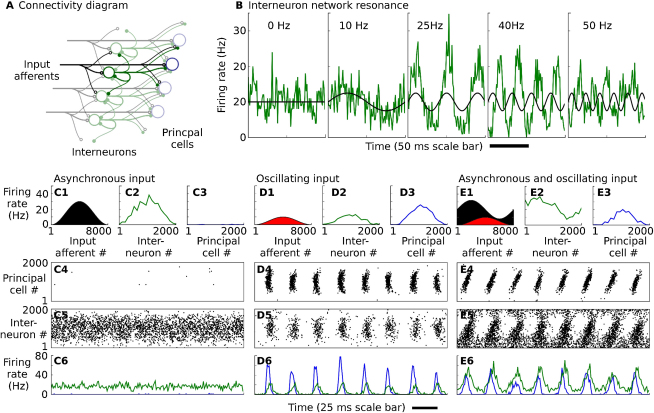
The mammalian brain exhibits profuse interregional connectivity. How information flow is rapidly and flexibly switched among connected areas remains poorly understood. Task-dependent changes in the power and interregion coherence of network oscillations suggest that such oscillations play a role in signal routing. We show that switching one of several convergent pathways from an asynchronous to an oscillatory state allows accurate selective transmission of population-coded information, which can be extracted even when other convergent pathways fire asynchronously at comparable rates. We further show that the band-pass filtering required to perform this information extraction can be implemented in a simple spiking network model with a single feed-forward interneuron layer. This constitutes a mechanism for flexible signal routing in neural circuits, which exploits sparsely synchronized network oscillations and temporal filtering by feed-forward inhibition.


Figures

Figure 1
Figure 1
Population-Coded Information and Oscillations Input networks represent independent variables as population codes with bell-shaped firing-rate tuning curves with respect to stimulus orientation. If one input network switches from an asynchronous state (blue) to an oscillating state (red), how much more information is available to the output network about the variable that it encodes?
Figure 2
Figure 2
Sender Network Activity (A and B) Spike raster showing 100 ms of activity in the sender network in the asynchronous (A) and oscillating (B) states. (A1 and B1) principal cell spike raster. (A2 and B2) Interneuron spike raster. (A3 and B3) Average firing rate for the principal cells (blue) and interneurons (green). (A4 and B4) Membrane potential of sample principal cell. (A5 and B5) Synaptic currents in sample principal cell (excitatory: blue; inhibitory: green; net current: red). (C) Average firing rate of a subpopulation of 400 principal cells over a 50 ms window in the asynchronous (C1) and oscillatory (C2) states. Activity was sampled from the areas indicated by colored outlines in the spike rasters (A1 and B1). (D) Fourier transforms of the subpopulation firing rates shown in (C). Arrows illustrate the 0 Hz (average firing rate) and 41 Hz (gamma amplitude) measurements used in later analysis.
Figure 3
Figure 3
Stimulus Representation in Network Activity (A) Activity in one oscillating and three asynchronous sender networks during 50 ms. (A1) Spike raster. (A2) Average principal cell firing rate for 20 subpopulations, each of 400 neurons. (A3) Spatial pattern of gamma amplitude (population firing-rate oscillation amplitude at 41 Hz) across the 20 subpopulations. (B) Postsynaptic input obtained by summing activity in the four sender networks. (C) Average 0 Hz amplitude (solid line) and gamma amplitude (dashed line) as function of stimulus orientation for (C1) presynaptic activity in oscillating (red) and asynchronous (blue) networks and (C2) summed postsynaptic input. Error bars represent standard deviation. For the combined input, both gamma amplitude and firing rate (0 Hz amplitude) show stimulus tuning, but the gamma amplitude is far less variable because of the small contribution of distracting inputs. (D) Accuracy of stimulus representation as measured by the orientation estimate standard deviation (D1) and Fisher information (D2); estimates decoded from activity in the sender network (S) or from the combined input from sender and distractor populations when the sender network was in an asynchronous state (A) or an oscillatory state (O).
Figure 4
Figure 4
Filter Network (A) Diagram of filter network connectivity showing the input afferents (black), feed-forward interneuron layer (green), and principal cells (blue). (B) Resonance in filter network interneuron population activity. Panels show the firing rate of the interneuron population (green) driven by periodically modulated Poisson spike input (mean rate indicated in black) at a range of frequencies bracketing the network resonance frequency (see Figure S1 as well). (C–E) Filter network principal cells reproduce position of oscillating input activity, irrespective of spatial pattern of asynchronous input. Filter network activity is driven by (C) asynchronous input, (D) gamma-modulated input, (E) mixed gamma-modulated and asynchronous input. (C1, D1, E1) Spatial pattern of firing rates in afferent fibers (black: asynchronous Poisson input, Poisson input sinusoidally modulated at 40 Hz). (C2, D2, E2) Spatial pattern of the firing rate in the interneuron layer. (C3, D3, E3) Spatial pattern of the firing rate in the principal cell layer. (C4, D4, E4) Spike raster for principal cells. (C5, D5, E5) Spike raster for interneurons. (C6, D6, E6) Firing rate of principal cell (blue) and interneuron (green) populations. See Figure S2 as well.
Figure 5
Figure 5
Time Course of Switching between Input Stimuli (A) Accuracy of the stimulus estimate decoded from the filter network output during the switch between input networks. (B) Firing rate in the input networks during switching. Blue traces: network switching from oscillating to asynchronous. Black traces: network switching from asynchronous to oscillating (note slow transition into oscillating state). Red traces: network rapidly switched from asynchronous to oscillating by giving the interneuron population a brief kick at the time of transition.
Figure 6
Figure 6
Multiplexing Multiple Signals in the Frequency Domain Four input networks, one asynchronous, one oscillating in the high gamma band, one in the low gamma band, and one in the beta band, converge to produce a combined pattern of input activity. Reading out the pattern of amplitude of the combined input at the appropriate frequency recovers the spatial pattern of activity in any one of the oscillating networks. (A) Spike rasters. (B) Spatial patterns of the firing rate. (C–E) Spatial pattern of the firing-rate oscillation amplitude in beta (C), low gamma (D), and high gamma (E) frequency bands. See Figure S3 as well.
Figure 7
Figure 7
Gating Time-Varying Stimuli (A) Spike rasters of principal cells in four input networks, each encoding a different time-varying stimulus. The network generating the raster (A1) is in the oscillating state, while the other three networks are in the asynchronous state. (B) Combined input obtained by summing activity in the input networks: (B1) spike raster, (B2) spatiotemporal pattern of gamma band amplitude, together with the stimulus driving oscillating network (red line) and the decoded stimulus estimate (black dots). (C) Activity in the filtering network when driven by convergent input: (C1) principal cell spike raster (black), stimulus driving oscillating network (red), stimulus estimate decoded from pyramidal cell activity (blue), (C2) interneuron spike raster, (C3) membrane potential of a sample principal cell, (C4) synaptic currents in a sample principal cell (inhibitory: green; excitatory: blue; net current: red).

References

    1. Anderson C.H., Van Essen D.C. Shifter circuits: a computational strategy for dynamic aspects of visual processing. Proc. Natl. Acad. Sci. USA. 1987;84:6297–6301. - PMC - PubMed
    1. Anderson J.R., Bothell D., Byrne M.D., Douglass S., Lebiere C., Qin Y. An integrated theory of the mind. Psychol. Rev. 2004;111:1036–1060. - PubMed
    1. Atallah B.V., Scanziani M. Instantaneous modulation of gamma oscillation frequency by balancing excitation with inhibition. Neuron. 2009;62:566–577. - PMC - PubMed
    1. Bauer M., Oostenveld R., Peeters M., Fries P. Tactile spatial attention enhances gamma-band activity in somatosensory cortex and reduces low-frequency activity in parieto-occipital areas. J. Neurosci. 2006;26:490–501. - PMC - PubMed
    1. Bennett M.V.L., Zukin R.S. Electrical coupling and neuronal synchronization in the Mammalian brain. Neuron. 2004;41:495–511. - PubMed

Publication types