

Quantifying whole transcriptome size, a prerequisite for understanding transcriptome evolution across species: an example from a plant allopolyploid
- PMID: 20671102
- PMCID: PMC2997557
- DOI: 10.1093/gbe/evq038
Quantifying whole transcriptome size, a prerequisite for understanding transcriptome evolution across species: an example from a plant allopolyploid
Abstract
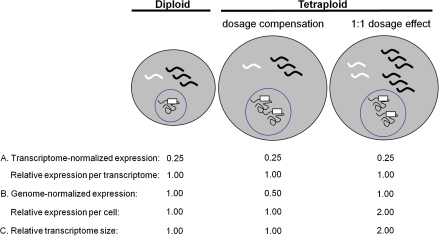
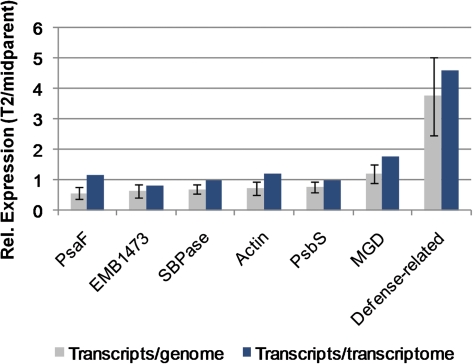
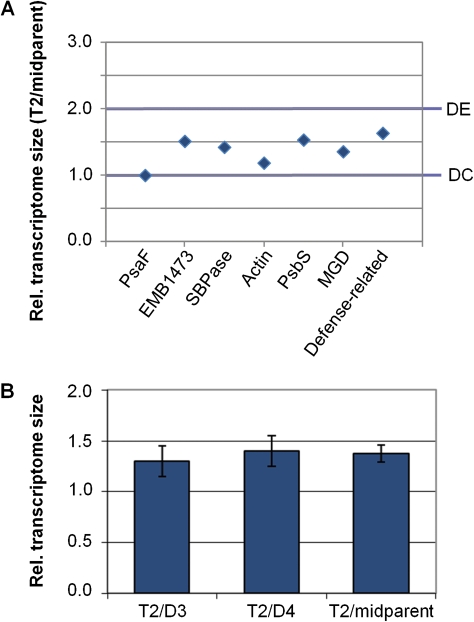
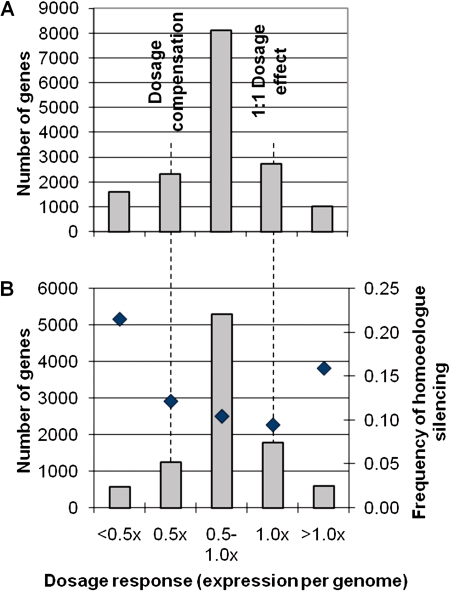
Evolutionary biologists are increasingly comparing gene expression patterns across species. Due to the way in which expression assays are normalized, such studies provide no direct information about expression per gene copy (dosage responses) or per cell and can give a misleading picture of genes that are differentially expressed. We describe an assay for estimating relative expression per cell. When used in conjunction with transcript profiling data, it is possible to compare the sizes of whole transcriptomes, which in turn makes it possible to compare expression per cell for each gene in the transcript profiling data set. We applied this approach, using quantitative reverse transcriptase-polymerase chain reaction and high throughput RNA sequencing, to a recently formed allopolyploid and showed that its leaf transcriptome was approximately 1.4-fold larger than either progenitor transcriptome (70% of the sum of the progenitor transcriptomes). In contrast, the allopolyploid genome is 94.3% as large as the sum of its progenitor genomes and retains > or =93.5% of the sum of its progenitor gene complements. Thus, "transcriptome downsizing" is greater than genome downsizing. Using this transcriptome size estimate, we inferred dosage responses for several thousand genes and showed that the majority exhibit partial dosage compensation. Homoeologue silencing is nonrandomly distributed across dosage responses, with genes showing extreme responses in either direction significantly more likely to have a silent homoeologue. This experimental approach will add value to transcript profiling experiments involving interspecies and interploidy comparisons by converting expression per transcriptome to expression per genome, eliminating the need for assumptions about transcriptome size.
Figures
Similar articles
-
A comparative transcriptomic study of an allotetraploid and its diploid progenitors illustrates the unique advantages and challenges of RNA-seq in plant species.Am J Bot. 2012 Feb;99(2):383-96. doi: 10.3732/ajb.1100312. Epub 2012 Feb 1. Am J Bot. 2012. PMID: 22301896
-
Gene expression dosage regulation in an allopolyploid fish.PLoS One. 2015 Mar 19;10(3):e0116309. doi: 10.1371/journal.pone.0116309. eCollection 2015. PLoS One. 2015. PMID: 25789776 Free PMC article.
-
Deciphering the complex leaf transcriptome of the allotetraploid species Nicotiana tabacum: a phylogenomic perspective.BMC Genomics. 2012 Aug 17;13:406. doi: 10.1186/1471-2164-13-406. BMC Genomics. 2012. PMID: 22900718 Free PMC article.
-
[The evolution and expression of low-copy nuclear genes in allopolyploid plants].Yi Chuan. 2007 Feb;29(2):163-71. doi: 10.1360/yc-007-0163. Yi Chuan. 2007. PMID: 17369170 Review. Chinese.
-
Variation in transcriptome size: are we getting the message?Chromosoma. 2015 Mar;124(1):27-43. doi: 10.1007/s00412-014-0496-3. Epub 2014 Nov 26. Chromosoma. 2015. PMID: 25421950 Review.
Cited by
-
Digital gene expression analysis of gene expression differences within Brassica diploids and allopolyploids.BMC Plant Biol. 2015 Jan 27;15:22. doi: 10.1186/s12870-015-0417-5. BMC Plant Biol. 2015. PMID: 25623840 Free PMC article.
-
Cytogenetics and Consequences of Polyploidization on Different Biotic-Abiotic Stress Tolerance and the Potential Mechanisms Involved.Plants (Basel). 2022 Oct 12;11(20):2684. doi: 10.3390/plants11202684. Plants (Basel). 2022. PMID: 36297708 Free PMC article. Review.
-
Gene Balance Predicts Transcriptional Responses Immediately Following Ploidy Change in Arabidopsis thaliana.Plant Cell. 2020 May;32(5):1434-1448. doi: 10.1105/tpc.19.00832. Epub 2020 Mar 17. Plant Cell. 2020. PMID: 32184347 Free PMC article.
-
Identification and characterization of genes with absolute mRNA abundances changes in tumor cells with varied transcriptome sizes.BMC Genomics. 2019 Feb 13;20(1):134. doi: 10.1186/s12864-019-5502-y. BMC Genomics. 2019. PMID: 30760197 Free PMC article.
-
The legacy of diploid progenitors in allopolyploid gene expression patterns.Philos Trans R Soc Lond B Biol Sci. 2014 Aug 5;369(1648):20130354. doi: 10.1098/rstb.2013.0354. Philos Trans R Soc Lond B Biol Sci. 2014. PMID: 24958927 Free PMC article. Review.
References
-
- Arumuganathan K, Earle ED. Estimation of nuclear DNA content of plants by flow cytometry. Plant Mol Biol Rep. 1991;9:217–229.
-
- Barow M. Endopolyploidy in seed plants. Bioessays. 2006;28:271–281. - PubMed
