

Transcriptional-metabolic networks in beta-carotene-enriched potato tubers: the long and winding road to the Golden phenotype
- PMID: 20671108
- PMCID: PMC2949014
- DOI: 10.1104/pp.110.159368
Transcriptional-metabolic networks in beta-carotene-enriched potato tubers: the long and winding road to the Golden phenotype
Abstract
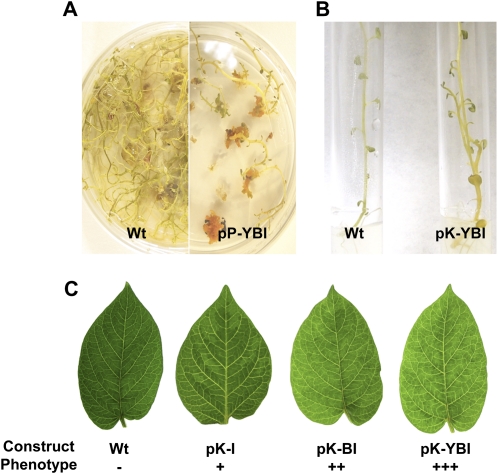
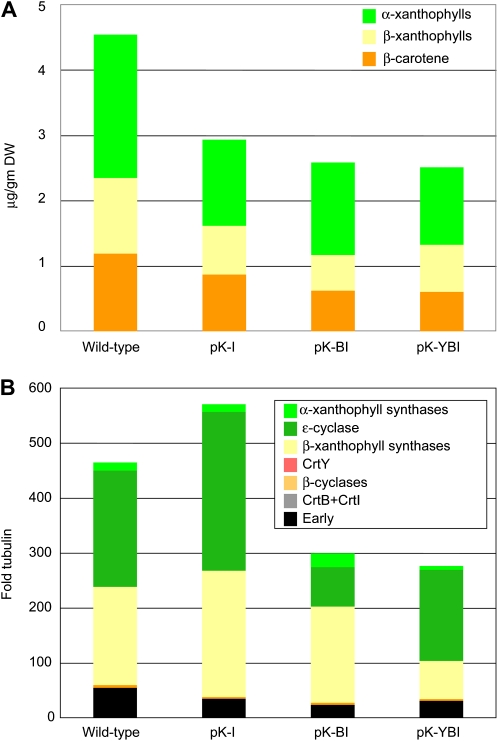
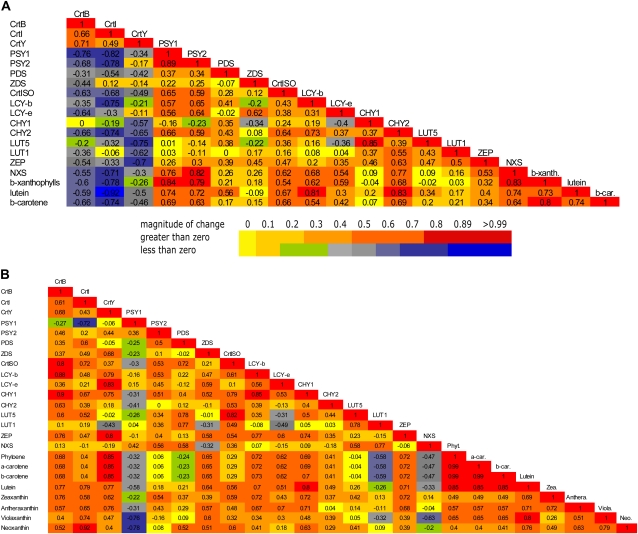
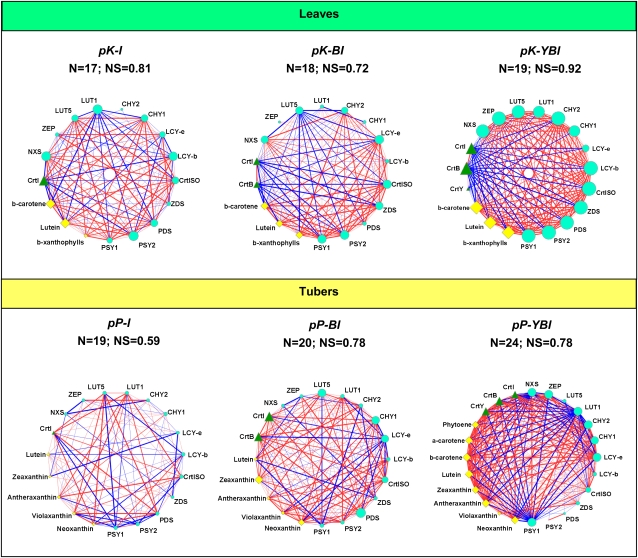
Vitamin A deficiency is a public health problem in a large number of countries. Biofortification of major staple crops (wheat [Triticum aestivum], rice [Oryza sativa], maize [Zea mays], and potato [Solanum tuberosum]) with β-carotene has the potential to alleviate this nutritional problem. Previously, we engineered transgenic "Golden" potato tubers overexpressing three bacterial genes for β-carotene synthesis (CrtB, CrtI, and CrtY, encoding phytoene synthase, phytoene desaturase, and lycopene β-cyclase, respectively) and accumulating the highest amount of β-carotene in the four aforementioned crops. Here, we report the systematic quantitation of carotenoid metabolites and transcripts in 24 lines carrying six different transgene combinations under the control of the 35S and Patatin (Pat) promoters. Low levels of B-I expression are sufficient for interfering with leaf carotenogenesis, but not for β-carotene accumulation in tubers and calli, which requires high expression levels of all three genes under the control of the Pat promoter. Tubers expressing the B-I transgenes show large perturbations in the transcription of endogenous carotenoid genes, with only minor changes in carotenoid content, while the opposite phenotype (low levels of transcriptional perturbation and high carotenoid levels) is observed in Golden (Y-B-I) tubers. We used hierarchical clustering and pairwise correlation analysis, together with a new method for network correlation analysis, developed for this purpose, to assess the perturbations in transcript and metabolite levels in transgenic leaves and tubers. Through a "guilt-by-profiling" approach, we identified several endogenous genes for carotenoid biosynthesis likely to play a key regulatory role in Golden tubers, which are candidates for manipulations aimed at the further optimization of tuber carotenoid content.
Figures


Similar articles
-
Metabolic engineering of potato carotenoid content through tuber-specific overexpression of a bacterial mini-pathway.PLoS One. 2007 Apr 4;2(4):e350. doi: 10.1371/journal.pone.0000350. PLoS One. 2007. PMID: 17406674 Free PMC article.
-
Metabolic engineering of high carotenoid potato tubers containing enhanced levels of beta-carotene and lutein.J Exp Bot. 2005 Jan;56(409):81-9. doi: 10.1093/jxb/eri016. Epub 2004 Nov 8. J Exp Bot. 2005. PMID: 15533882
-
Metabolic engineering of potato tuber carotenoids through tuber-specific silencing of lycopene epsilon cyclase.BMC Plant Biol. 2006 Jun 26;6:13. doi: 10.1186/1471-2229-6-13. BMC Plant Biol. 2006. PMID: 16800876 Free PMC article.
-
Golden Rice: introducing the beta-carotene biosynthesis pathway into rice endosperm by genetic engineering to defeat vitamin A deficiency.J Nutr. 2002 Mar;132(3):506S-510S. doi: 10.1093/jn/132.3.506S. J Nutr. 2002. PMID: 11880581 Review.
-
Nutritious crops producing multiple carotenoids--a metabolic balancing act.Trends Plant Sci. 2011 Oct;16(10):532-40. doi: 10.1016/j.tplants.2011.08.001. Epub 2011 Sep 6. Trends Plant Sci. 2011. PMID: 21900035 Review.
Cited by
-
Carotenoid accumulation during tomato fruit ripening is modulated by the auxin-ethylene balance.BMC Plant Biol. 2015 May 8;15:114. doi: 10.1186/s12870-015-0495-4. BMC Plant Biol. 2015. PMID: 25953041 Free PMC article.
-
Study of 'Redhaven' peach and its white-fleshed mutant suggests a key role of CCD4 carotenoid dioxygenase in carotenoid and norisoprenoid volatile metabolism.BMC Plant Biol. 2011 Jan 26;11:24. doi: 10.1186/1471-2229-11-24. BMC Plant Biol. 2011. PMID: 21269483 Free PMC article.
-
Gene-Metabolite Networks of Volatile Metabolism in Airen and Tempranillo Grape Cultivars Revealed a Distinct Mechanism of Aroma Bouquet Production.Front Plant Sci. 2016 Oct 27;7:1619. doi: 10.3389/fpls.2016.01619. eCollection 2016. Front Plant Sci. 2016. PMID: 27833635 Free PMC article.
-
Transcriptome analysis in tissue sectors with contrasting crocins accumulation provides novel insights into apocarotenoid biosynthesis and regulation during chromoplast biogenesis.Sci Rep. 2018 Feb 12;8(1):2843. doi: 10.1038/s41598-018-21225-z. Sci Rep. 2018. PMID: 29434251 Free PMC article.
-
Enzymatic study on AtCCD4 and AtCCD7 and their potential to form acyclic regulatory metabolites.J Exp Bot. 2016 Nov;67(21):5993-6005. doi: 10.1093/jxb/erw356. Epub 2016 Oct 6. J Exp Bot. 2016. PMID: 27811075 Free PMC article.
References
-
- Al-Babili S, Hoa TT, Schaub P. (2006) Exploring the potential of the bacterial carotene desaturase CrtI to increase the beta-carotene content in Golden Rice. J Exp Bot 57: 1007–1014 - PubMed
-
- Al-Babili S, Hugueney P, Schledz M, Welsch R, Frohnmeyer H, Laule O, Beyer P. (2000) Identification of a novel gene coding for neoxanthin synthase from Solanum tuberosum. FEBS Lett 485: 168–172 - PubMed
-
- Auldridge ME, McCarty DR, Klee HJ. (2006) Plant carotenoid cleavage oxygenases and their apocarotenoid products. Curr Opin Plant Biol 9: 315–321 - PubMed
Publication types
MeSH terms
Substances
LinkOut - more resources
Full Text Sources
Other Literature Sources
