

Extracellular nucleotides elicit cytosolic free calcium oscillations in Arabidopsis
- PMID: 20671112
- PMCID: PMC2949047
- DOI: 10.1104/pp.110.162503
Extracellular nucleotides elicit cytosolic free calcium oscillations in Arabidopsis
Abstract
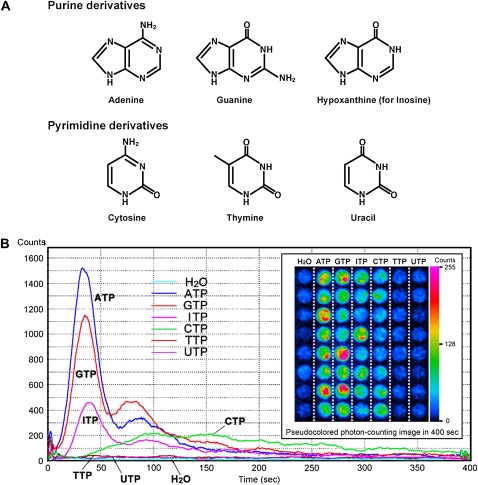
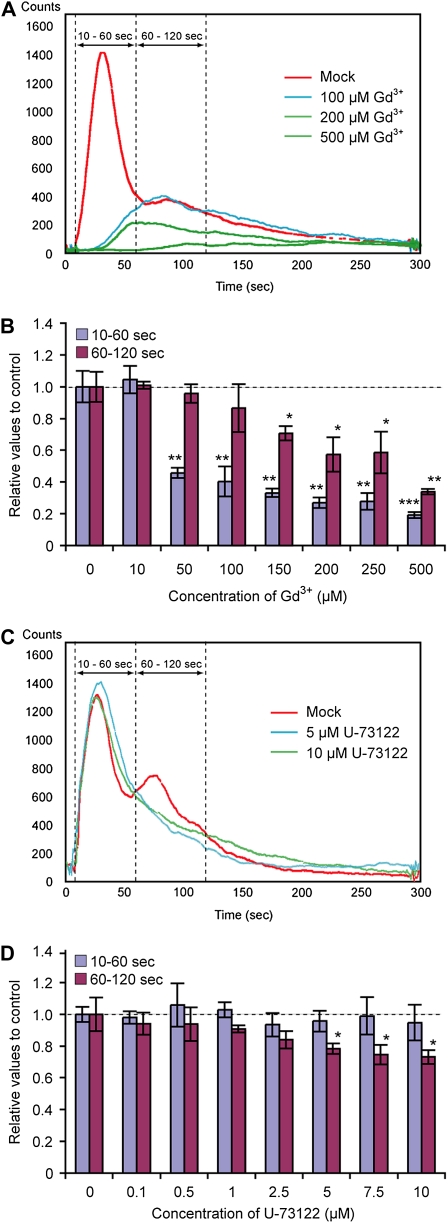
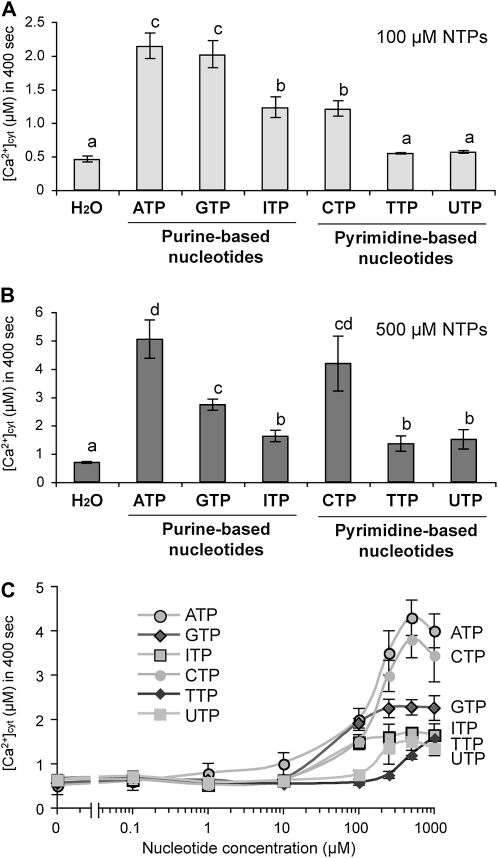
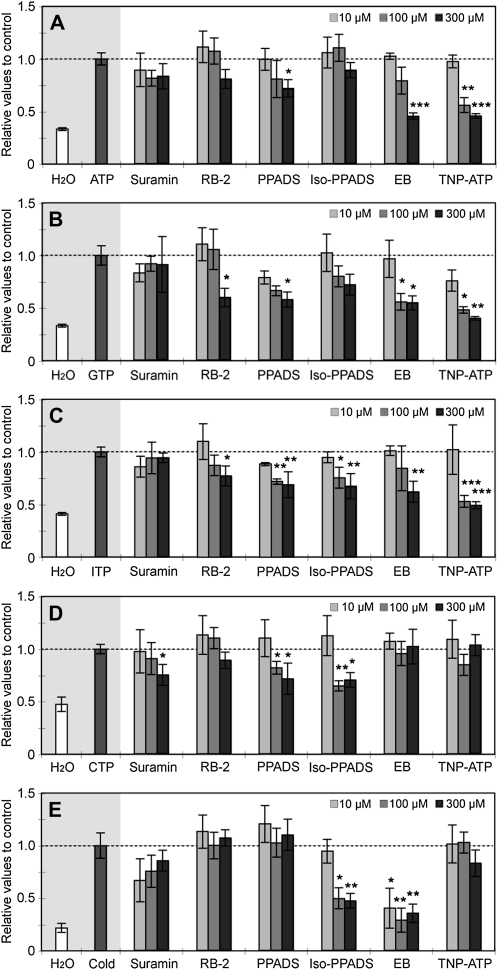
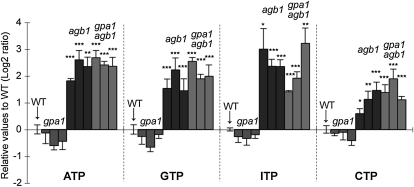
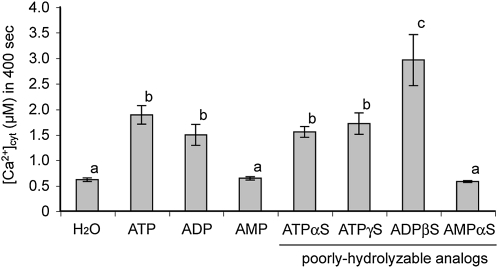
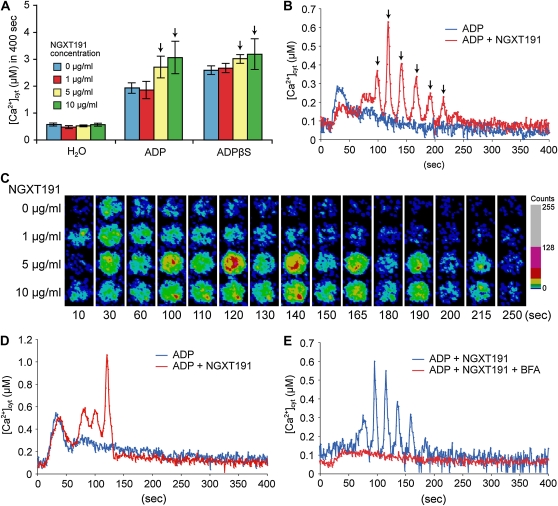
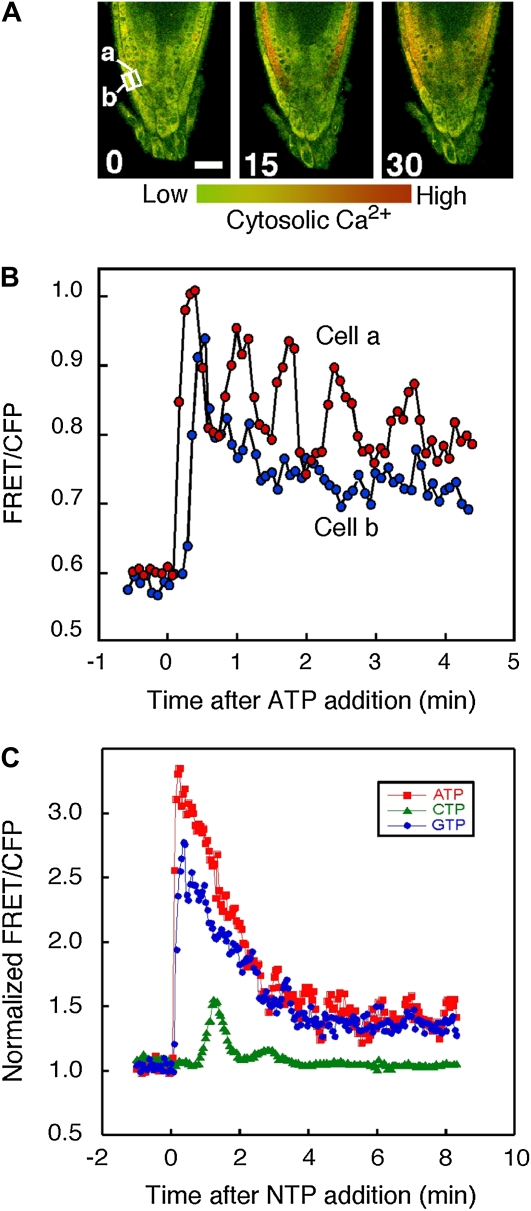
Extracellular ATP induces a rise in the level of cytosolic free calcium ([Ca(2+)](cyt)) in plant cells. To expand our knowledge about the function of extracellular nucleotides in plants, the effects of several nucleotide analogs and pharmacological agents on [Ca(2+)](cyt) changes were studied using transgenic Arabidopsis (Arabidopsis thaliana) expressing aequorin or the fluorescence resonance energy transfer-based Ca(2+) sensor Yellow Cameleon 3.6. Exogenously applied CTP caused elevations in [Ca(2+)](cyt) that displayed distinct time- and dose-dependent kinetics compared with the purine nucleotides ATP and GTP. The inhibitory effects of antagonists of mammalian P2 receptors and calcium influx inhibitors on nucleotide-induced [Ca(2+)](cyt) elevations were distinct between CTP and purine nucleotides. These results suggest that distinct recognition systems may exist for the respective types of nucleotides. Interestingly, a mutant lacking the heterotrimeric G protein Gβ-subunit exhibited a remarkably higher [Ca(2+)](cyt) elevation in response to all tested nucleotides in comparison with the wild type. These data suggest a role for Gβ in negatively regulating extracellular nucleotide signaling and point to an important role for heterotrimeric G proteins in modulating the cellular effects of extracellular nucleotides. The addition of extracellular nucleotides induced multiple temporal [Ca(2+)](cyt) oscillations, which could be localized to specific root cells. The oscillations were attenuated by a vesicle-trafficking inhibitor, indicating that the oscillations likely require ATP release via exocytotic secretion. The results reveal new molecular details concerning extracellular nucleotide signaling in plants and the importance of fine control of extracellular nucleotide levels to mediate specific plant cell responses.
Figures
Similar articles
-
Fluorescence resonance energy transfer-sensitized emission of yellow cameleon 3.60 reveals root zone-specific calcium signatures in Arabidopsis in response to aluminum and other trivalent cations.Plant Physiol. 2010 Mar;152(3):1442-58. doi: 10.1104/pp.109.147256. Epub 2010 Jan 6. Plant Physiol. 2010. PMID: 20053711 Free PMC article.
-
Nitric oxide triggers specific and dose-dependent cytosolic calcium transients in Arabidopsis.Plant Signal Behav. 2009 Mar;4(3):191-6. doi: 10.4161/psb.4.3.8256. Plant Signal Behav. 2009. PMID: 19721746 Free PMC article.
-
Arabidopsis transcriptional response to extracellular Ca2+ depletion involves a transient rise in cytosolic Ca2+.J Integr Plant Biol. 2015 Feb;57(2):138-50. doi: 10.1111/jipb.12218. Epub 2014 Jul 8. J Integr Plant Biol. 2015. PMID: 24850424
-
Enlightenment on the aequorin-based platform for screening Arabidopsis stress sensory channels related to calcium signaling.Plant Signal Behav. 2015;10(11):e1057366. doi: 10.1080/15592324.2015.1057366. Plant Signal Behav. 2015. PMID: 26336841 Free PMC article. Review.
-
Pharmacological Strategies for Manipulating Plant Ca2+ Signalling.Int J Mol Sci. 2018 May 18;19(5):1506. doi: 10.3390/ijms19051506. Int J Mol Sci. 2018. PMID: 29783646 Free PMC article. Review.
Cited by
-
Understanding the mechanobiology of phytoacoustics through molecular Lens: Mechanisms and future perspectives.J Adv Res. 2024 Nov;65:47-72. doi: 10.1016/j.jare.2023.12.011. Epub 2023 Dec 13. J Adv Res. 2024. PMID: 38101748 Free PMC article. Review.
-
Early Extracellular ATP Signaling in Arabidopsis Root Epidermis: A Multi-Conductance Process.Front Plant Sci. 2019 Sep 4;10:1064. doi: 10.3389/fpls.2019.01064. eCollection 2019. Front Plant Sci. 2019. PMID: 31552068 Free PMC article.
-
Release of extracellular purines from plant roots and effect on ion fluxes.Plant Signal Behav. 2011 Nov;6(11):1855-7. doi: 10.4161/psb.6.11.17014. Epub 2011 Nov 1. Plant Signal Behav. 2011. PMID: 22057319 Free PMC article.
-
A histochemical reporter system to study extracellular ATP response in plants.Front Plant Sci. 2023 Jun 2;14:1183335. doi: 10.3389/fpls.2023.1183335. eCollection 2023. Front Plant Sci. 2023. PMID: 37332691 Free PMC article.
-
ATP Synthase Members of Chloroplasts and Mitochondria in Rubber Trees (Hevea brasiliensis) Response to Plant Hormones.Plants (Basel). 2025 Feb 17;14(4):604. doi: 10.3390/plants14040604. Plants (Basel). 2025. PMID: 40006862 Free PMC article.
References
-
- Allen GJ, Kwak JM, Chu SP, Llopis J, Tsien RY, Harper JF, Schroeder JI. (1999) Cameleon calcium indicator reports cytoplasmic calcium dynamics in Arabidopsis guard cells. Plant J 19: 735–747 - PubMed
-
- Anderson CM, Bergher JP, Swanson RA. (2004) ATP-induced ATP release from astrocytes. J Neurochem 88: 246–256 - PubMed
-
- Berridge MJ, Bootman MD, Roderick HL. (2003) Calcium signalling: dynamics, homeostasis and remodelling. Nat Rev Mol Cell Biol 4: 517–529 - PubMed
Publication types
MeSH terms
Substances
LinkOut - more resources
Full Text Sources
Molecular Biology Databases
Miscellaneous
