. 2010 Jul 29;17(8):381-93.
doi: 10.1101/lm.1829110. Print 2010 Aug.

The shift from a response strategy to object-in-place strategy during learning is accompanied by a matching shift in neural firing correlates in the hippocampus

Affiliations

The shift from a response strategy to object-in-place strategy during learning is accompanied by a matching shift in neural firing correlates in the hippocampus

Inah Lee et al. Learn Mem. .

Abstract

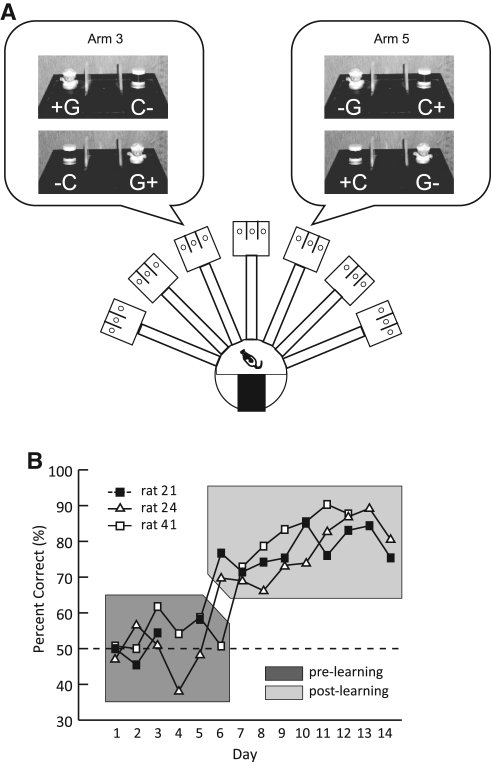
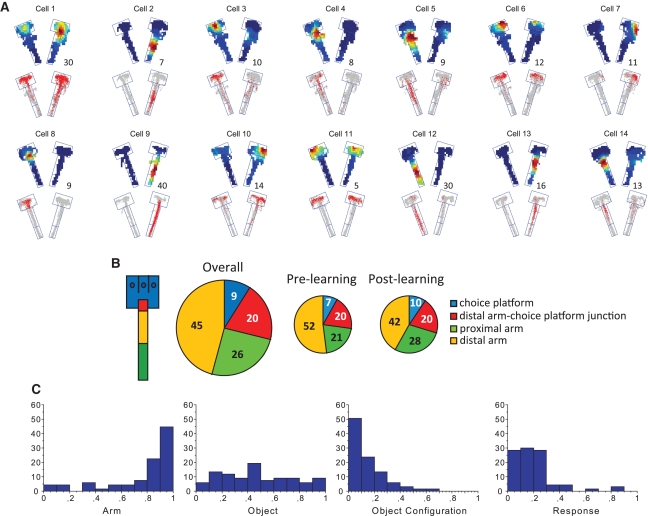
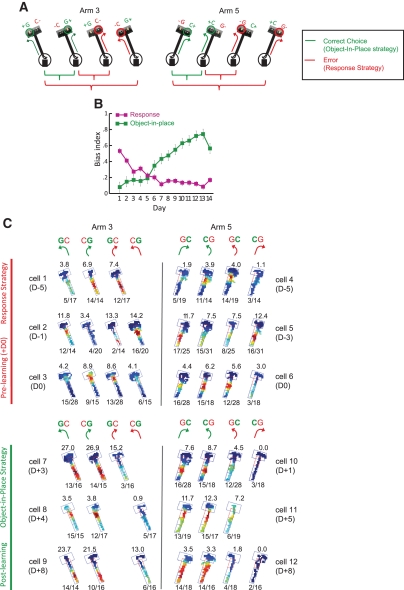
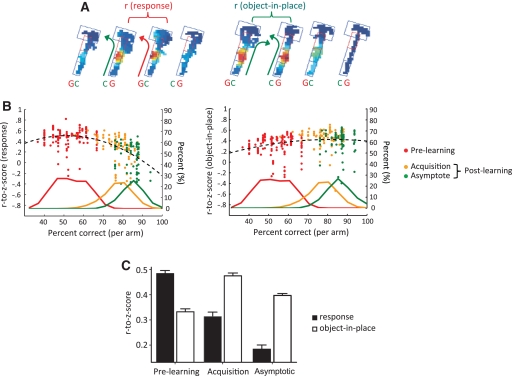
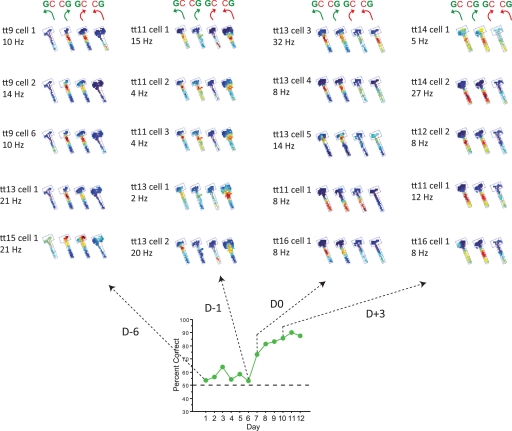
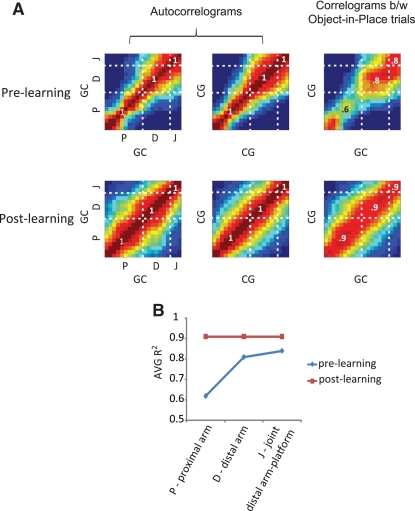
Hippocampal-dependent tasks often involve specific associations among stimuli (including egocentric information), and such tasks are therefore prone to interference from irrelevant task strategies before a correct strategy is found. Using an object-place paired-associate task, we investigated changes in neural firing patterns in the hippocampus in association with a shift in strategy during learning. We used an object-place paired-associate task in which a pair of objects was presented in two different arms of a radial maze. Each object was associated with reward only in one of the arms, thus requiring the rats to consider both object identity and its location in the maze. Hippocampal neurons recorded in CA1 displayed a dynamic transition in their firing patterns during the acquisition of the task across days, and this corresponded to a shift in strategy manifested in behavioral data. Specifically, before the rats learned the task, they chose an object that maintained a particular egocentric relationship with their body (response strategy) irrespective of the object identity. However, as the animal acquired the task, it chose an object according to both its identity and the associated location in the maze (object-in-place strategy). We report that CA1 neurons in the hippocampus changed their prospective firing correlates according to the dominant strategy (i.e., response versus object-in-place strategy) employed at a given stage of learning. The results suggest that neural firing pattern in the hippocampus is heavily influenced by the task demand hypothesized by the animal and the firing pattern changes flexibly as the perceived task demand changes.


Figures

Figure 1.
Figure 1.
Acquisition of the object-place paired-associate task. (A) Overview of the radial arm maze. The start box is shown as a black rectangle. Insets illustrate possible spatial configurations of the objects (G: toy girl, C: cylinder) and correct choices (+: reward, −: no reward) in the choice platform in either arm 3 or arm 5. (B) Learning curves of all animals across days. Chance-level performance (50%) is denoted by the dotted line. The acquisition periods before and after the rats exceeded the criterion are indicated by a dark gray area and light gray area, respectively. Data for Day 4 in rat 21 and Days 13 and 14 in rat 41 are unavailable due to technical problems during data collection.
Figure 2.
Figure 2.
Firing characteristics of hippocampal neurons in object-place paired association. (A) Representative examples of average spatial firing patterns of CA1 neurons in the maze (center platform excluded). Cells shown were not recorded simultaneously. (Upper) Color-coded firing rate map (maximum firing rate in hertz shown as number). (Lower) Raw spiking positions (red) overlaid on position traces (gray). Physical boundaries of arms 3 and 5 are shown in each example. (B) The maze arm was divided into arbitrary zones (color-coded). The proportion of CA1 neurons whose firing field locations (COM) were found in different zones are shown as pie charts for the entire training period (Overall) as well as separately for both pre- and post-learning periods. Numbers show percent. (C) Proportional distributions of CA1 neurons with respect to their firing correlates with a specific arm, object, object configuration, or bias toward a specific turning direction.
Figure 3.
Figure 3.
Differential firing patterns before and after the object-place paired-associate learning. (A) Categorical parsing of trials for analytical purposes considering the relative locations of the objects in the choice platform and turning directions (shown as arrows). Green and red circles over objects indicate objects displaced correctly and incorrectly, respectively. Correct choice (object-in-place strategy): A pair of trial conditions in which the rat made rule-relevant choices (resulting in opposite turning directions between different object configurations); Error (response strategy): A pair of trial conditions in which the animals made rule-irrelevant choices (showing the same turning direction). (B) The relationship between the object-in-place bias (the preference for the target object regardless of the associated turning directions) and the response bias as learning proceeded across days (error bar = mean ± S.E.M.). (C) Representative examples of firing rate maps of neurons recorded in either arm 3 or arm 5 during the pre-learning period (cells 1 to 6, upper panel) and the ones recorded in the post-learning period (cells 7 to 12, lower panel). Cells shown were not necessarily recorded simultaneously. D0 indicates the first day when the rats reached the criterion performance level. For each neuron, the overall firing pattern was broken down into individual rate maps for different trial conditions following the scheme shown in A. The number over each rate map shows the maximum firing rate (hertz) and the number below the rate map indicates the number of trials for a given trial condition for the total number of trials performed with the specific object-arm paired configuration. Only the trial conditions with more than two trials/conditions are shown.
Figure 4.
Figure 4.
Increased similarity in CA1 neuronal firing patterns between rule-relevant trial conditions parallel the increase in performance in the object-place paired-associate task. (A) The similarity of spatial firing patterns of a neuron was measured between different trial conditions by calculating the pixel-by-pixel Pearson's correlation coefficient between the rate maps separately constructed from those conditions. Examples showing how to calculate the correlations between the rate maps for response strategy-based trials (left) and object-in-place strategy-based trials (right) are shown (arm 5). Both left- and right-turn paired trials were analyzed and the bigger one was taken for the regression analysis (only left-turn pairs were shown in the figure for illustrative purpose). Arrows indicate turning directions of the animals in those trials types. Green and red colors for arrows and object abbreviations indicate correct and incorrect choices, respectively. (B) Bivariate scatter plots showing the relationship between performance and the similarity in firing patterns between response trials (left) or object-in-place trials (right). To calculate the similarity in firing pattern, cross-correlation was performed between the firing rate maps. Correlation coefficient was then normalized using Fisher's r-to-z transformation. The dotted lines indicate polynomial fitting lines with order 2. Scatter points were color-coded on the basis of learning stages and color-matched, proportional distributions of behavioral performance data were shown along the x-axis to illustrate the time course of the firing correlates across learning. The second y-axis on the right side of the figure is to indicate the proportional distribution of behavioral performance. (C) Fisher's r-to-z transformation of the correlation coefficients calculated between rate maps. As shown in B, the similarity in firing patterns between object-in-place trials increased in the post-learning period (acquisition and asymptote) and the reverse trend was observed in response-based trials.
Figure 5.
Figure 5.
Ensemble firing patterns throughout learning in a single rat. Rate maps for different trial conditions from simultaneously recorded CA1 neurons are shown for selected days during learning. Maximal firing rate (hertz) is shown for each neuron. Line graphs show the overall performance (on average including arms 3 and 5) of the animal across days (upper) and the same animal's performances in arm 3 (middle) and arm 5 (lower) separately. Only trial conditions with over two trials/condition are shown.
Figure 6.
Figure 6.
Increase in the similarity between prospective neuronal firing after learning at a population level. (A) Color-coded matrices showing correlations between population firing-rate vectors along the arm before and after the acquisition of the task (up to the junction between the distal arm and the choice platform, denoted by “J” in each matrix; “P” and “D” refer to the proximal and distal regions of the arm, respectively). “CG” and “GC” indicate trial types. Numbers in the matrix indicate correlation coefficients (along the diagonal) for different zones (the boundaries of which are marked by dotted lines) in the arm. (B) When pre- and post-learning periods were compared, only the proximal arm zone displayed a significantly increased similarity between object-in-place trial conditions. AVG R2 denotes the average correlation coefficient along the diagonal in a given zone (e.g., proximal arm or “P”) in the correlation matrix in A.

Similar articles

Cited by

References

    1. Breese CR, Hampson RE, Deadwyler SA 1989. Hippocampal place cells: Stereotypy and plasticity. J Neurosci 9: 1097–1111 - PMC - PubMed
    1. Burwell RD 2000. The parahippocampal region: Corticocortical connectivity. Ann N Y Acad Sci 911: 25–42 - PubMed
    1. Chang Q, Gold PE 2003. Switching memory systems during learning: Changes in patterns of brain acetylcholine release in the hippocampus and striatum in rats. J Neurosci 23: 3001–3005 - PMC - PubMed
    1. Eifuku S, Nishijo H, Kita T, Ono T 1995. Neuronal activity in the primate hippocampal formation during a conditional association task based on the subject's location. J Neurosci 15: 4952–4969 - PMC - PubMed
    1. Eschenko O, Mizumori SJY 2007. Memory influences on hippocampal and striatal neural codes: Effects of a shift between task rules. Neurobiol Learn Mem 87: 495–509 - PMC - PubMed

Publication types

LinkOut - more resources