. 2010 Jul 30;329(5991):533-8.
doi: 10.1126/science.1188308.

Quantifying E. coli proteome and transcriptome with single-molecule sensitivity in single cells

Affiliations

Quantifying E. coli proteome and transcriptome with single-molecule sensitivity in single cells

Yuichi Taniguchi et al. Science. .

Erratum in

  • Science. 2011 Oct 28;334(6055):453

Abstract

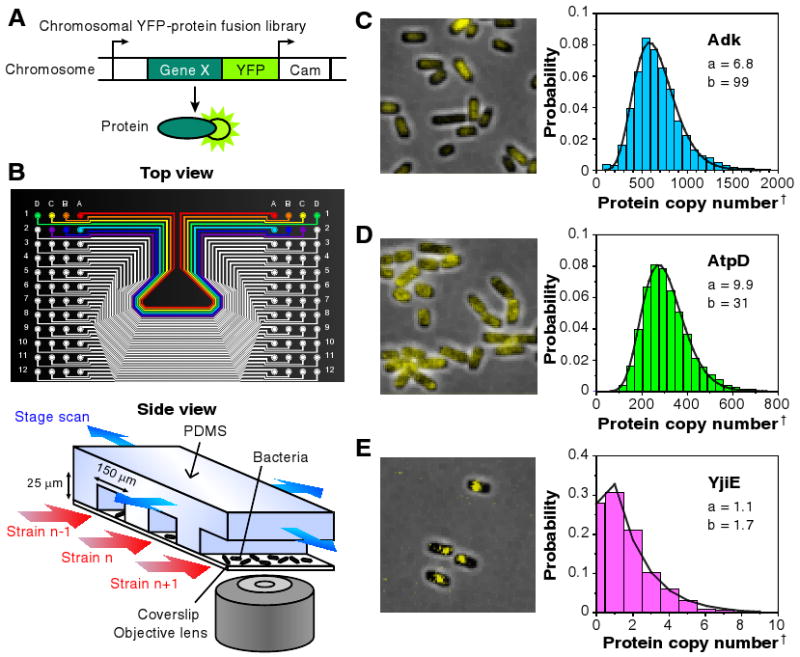
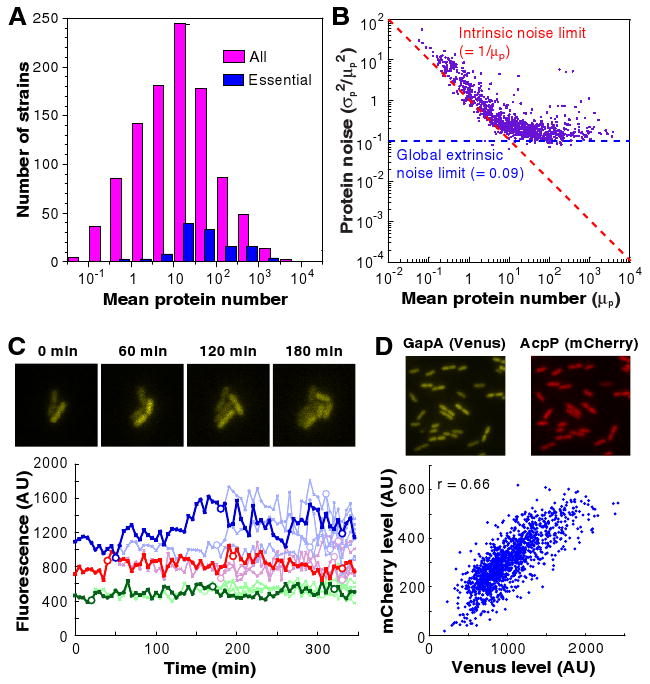
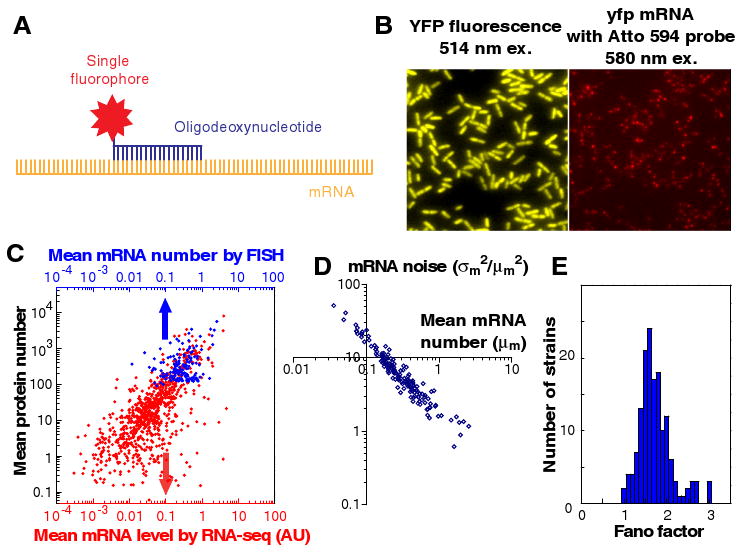
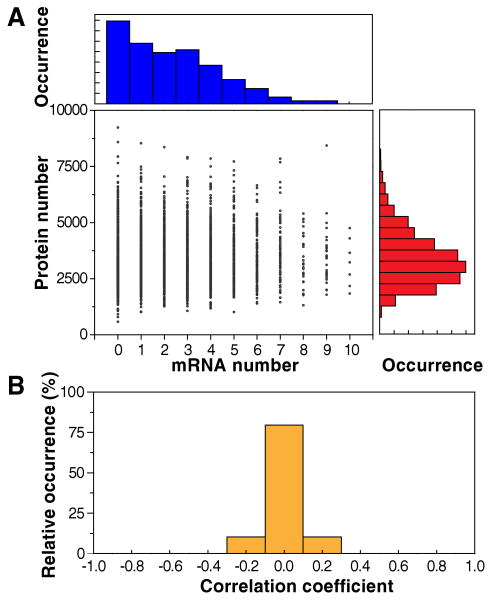
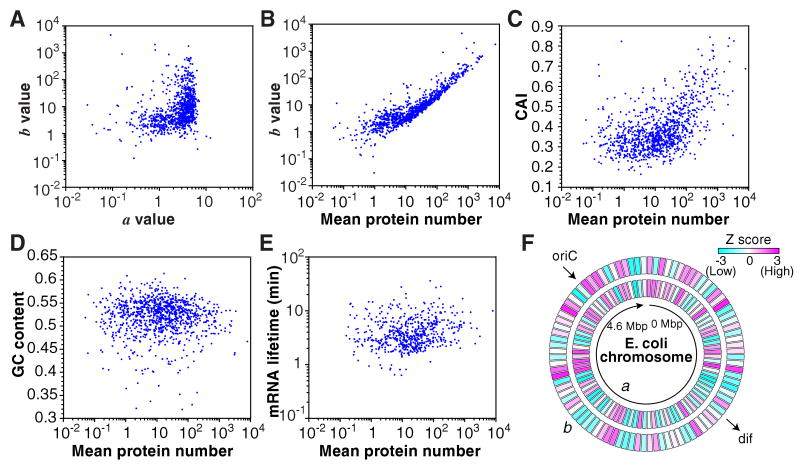
Protein and messenger RNA (mRNA) copy numbers vary from cell to cell in isogenic bacterial populations. However, these molecules often exist in low copy numbers and are difficult to detect in single cells. We carried out quantitative system-wide analyses of protein and mRNA expression in individual cells with single-molecule sensitivity using a newly constructed yellow fluorescent protein fusion library for Escherichia coli. We found that almost all protein number distributions can be described by the gamma distribution with two fitting parameters which, at low expression levels, have clear physical interpretations as the transcription rate and protein burst size. At high expression levels, the distributions are dominated by extrinsic noise. We found that a single cell's protein and mRNA copy numbers for any given gene are uncorrelated.


Figures

Figure 1
Figure 1
Quantitative imaging of a YFP-fusion library. (A) Each library strain has a yellow fluorescent protein (YFP) translationally fused to the C-terminus of a protein in its native chromosomal position. (B) A poly-dimethylsiloxane (PDMS) microfluidic chip is used for imaging 96 library strains. E. coli cells of each strain are injected into separate lanes and immobilized on a polylysine-coated coverslip for automated fluorescence imaging with single molecule sensitivity. (C-E) Representative fluorescence images overlaid on phase contrast images of three library strains, with respective single cell protein level histograms that are fit to gamma distributions with parameters a and b. Protein levels are determined by deconvolution (18). †The protein copy number per average cell volume, or the concentration, was determined as described in the main text and the SOM. (C) Cytoplasmic protein, Adk, uniformly distributed intracellularly. (D) Membrane protein, AtpD, distributed on the cell periphery. (E) Predicted DNA-binding protein, YjiE, with clear intercellular localization. Single YFPs can be visualized via detection by localization. Note unlike (C) and (D), the gamma distribution asymmetrically peaks near zero if a is close to or less than unity.
Figure 2
Figure 2
Profiling of protein abundance and noise. (A) Histogram of average copy numbers of essential proteins (blue) and all proteins (pink) for 1,018 library strains. Almost all essential proteins are expressed at above an average of 10 copies / cell, while some non-essential proteins have lower abundances. (B) Protein expression noise (σp2/μp2) versus the mean copy number per cell (μp). When μp <10, protein expression noise is inversely proportional to the mean, with as lower noise limit (red dashed line), as expected for intrinsic noise. When μp >10, noise becomes independent of the mean and is always above ∼0.1 (noise limit indicated by blue dashed lines), because of extrinsic noise. (C) Real time observation of slow fluctuation of protein levels at a time scale longer than a cell cycle, originating from extrinsic noise. Each time trace of fluorescence is normalized by cell size, and represents a cell lineage of strain expressing AcpP-YFP. The dark line follows a single lineage; the rest of the descendents have a lighter colored line. Each circle represents a cell division event. The variation among different cells arises primarily from slowly-varying extrinsic noise because the fluctuations within one cell over a cell cycle are comparatively small. (D) Two-color measurements of correlations of two different proteins in the same cell. Two highly-expressed proteins, GapA and AcpP, are respectively labeled with Venus (YFP) and mCherry (RFP) in the same E. coli strain. The protein levels are correlated, with a correlation coefficient of 0.66, supporting the hypothesis that the dependence on global extrinsic factors like ribosomes, rather than gene-specific factors, dominates the extrinsic noise at high expression levels (see (18)).
Figure 3
Figure 3
mRNA profiling of the YFP-fusion library with single molecule sensitivity in single cells. (A) The mRNA of a tagged gene can be detected by fluorescence in situ hybridization (FISH) against the yfp mRNA sequence using a DNA oligo probe that is labeled with a single Atto594 fluorophore. (B) Protein (left) and mRNA (right) of the same gene are detected simultaneously in the same fixed cells. (C) Mean mRNA number, measured by RNA-seq (red) and by FISH (blue), and mean protein number are correlated. The respective Pearson correlation coefficients (r) are 0.54 and 0.77. Each dot is average of a gene. The FISH data were taken for genes that express >100 copies of proteins per cell, whereas the RNA-seq data includes all expressed mRNAs, which are not fused to the yfp tag. (D) mRNA noise (σm2/μm2) scales inversely with mRNA mean number (μm), and is higher than expected for Poisson distributions. (E) Histogram of mRNA Fano factors for 137 highly-expressed genes. The mRNA Fano factor (σm2/μm) of the measured strains have similar values centered around 1.6, indicating non-Poissonian mRNA production or degradation.
Figure 4
Figure 4
No correlation between mRNA and protein levels in a single cell at a particular time. (A) Histograms of mRNA (top) and protein (right) levels. Protein vs. mRNA copy number plot for the TufA-YFP strain, in which TufA is tagged with YFP. Each point represents a single cell of the strain. Strikingly, the correlation coefficient is r = 0.01 ± 0.03 (mean ± SD, N = 5,447). (B) Histogram of correlation coefficients from 129 strains with highly expressed labeled genes whose sampling error for the correlation coefficient is <0.1. The histogram indicates that the lack of correlation between mRNA and protein levels in a single cell is a general phenomenon.
Figure 5
Figure 5
Correlation between expression and gene characteristics. (A) Correlation plots of a and b (r = 0.01) and (B) mean protein expression versus b (r = 0.72). a and b values are calculated as a = μp2/σp2 and b = σp2/μp, respectively, using the mean, μp, and standard deviation, σp, of the protein number histograms. (C) Correlation plots of mean protein expression versus codon adaptation index (CAI) (r = 0.40), (D) GC content (r = -0.06) and (E) mRNA lifetime (r = 0.08). (F) Chromosomal dependence of a and b values. Z scores of more than 3 (indicated by red) represent a significantly larger value compared with the whole genome distribution with >99.9% confidence, while Z scores less than -3 (indicated by blue) represent a significantly smaller value.

Comment in

Similar articles

Cited by

References

    1. Rao CV, Wolf DM, Arkin AP. Nature. 2002 Nov 14;420:231. - PubMed
    1. Raser JM, O'Shea EK. Science. 2004 Jun 18;304:1811. - PMC - PubMed
    1. Rosenfeld N, Young JW, Alon U, Swain PS, Elowitz MB. Science. 2005 Mar 25;307:1962. - PubMed
    1. Pedraza JM, van Oudenaarden A. Science. 2005 Mar 25;307:1965. - PubMed
    1. Friedman N, Cai L, Xie XS. Physical review letters. 2006 Oct 20;97:168302. - PubMed

Publication types

MeSH terms