. 2010 Nov;51(11):3230-42.
doi: 10.1194/jlr.M007641. Epub 2010 Jul 29.

Effects of feeding bile acids and a bile acid sequestrant on hepatic bile acid composition in mice

Affiliations

Effects of feeding bile acids and a bile acid sequestrant on hepatic bile acid composition in mice

Youcai Zhang et al. J Lipid Res. 2010 Nov.

Abstract

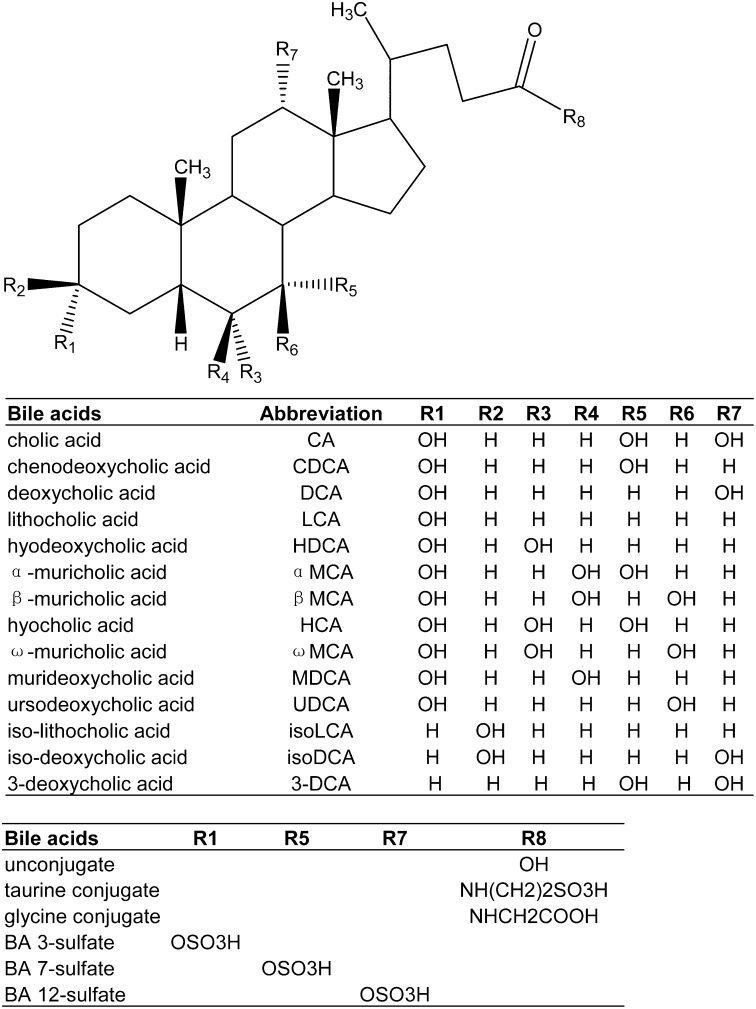
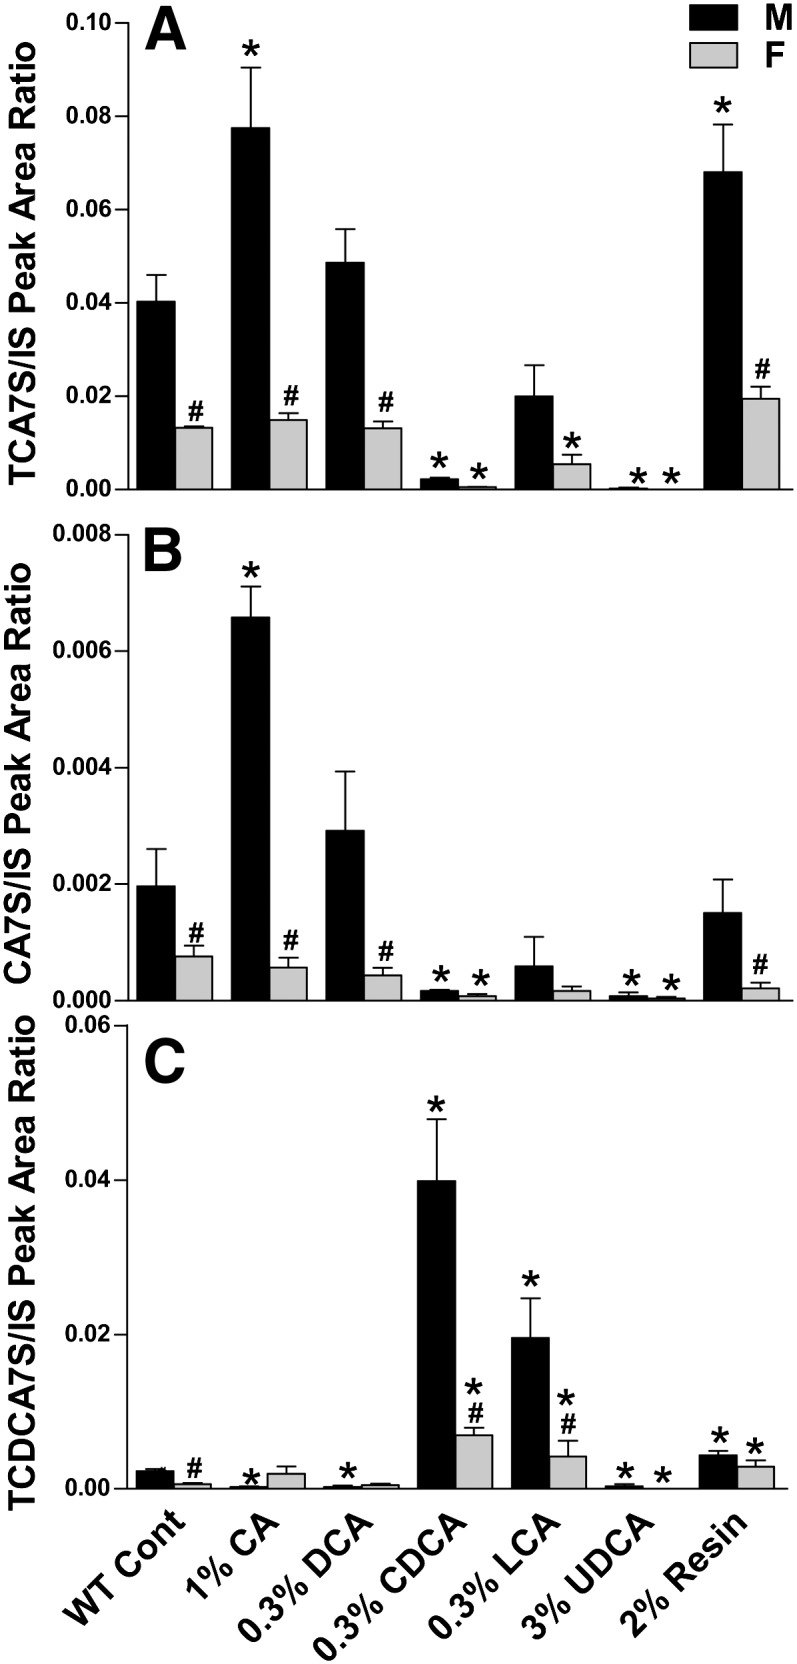
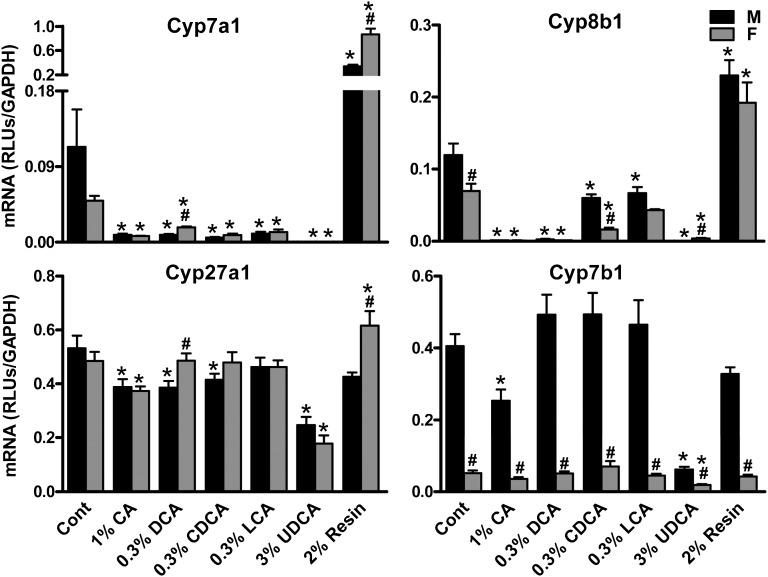
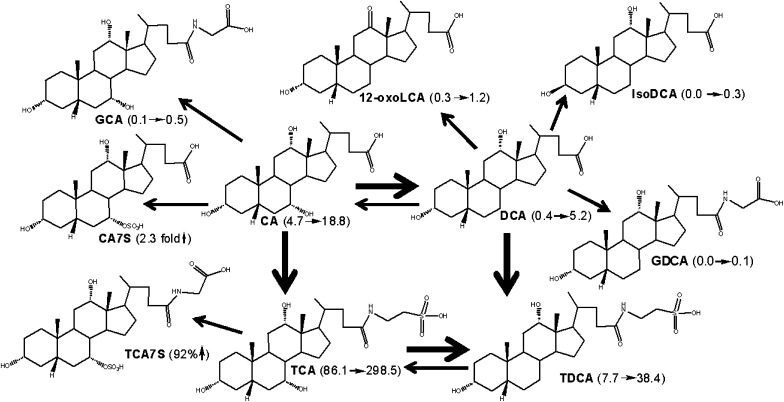
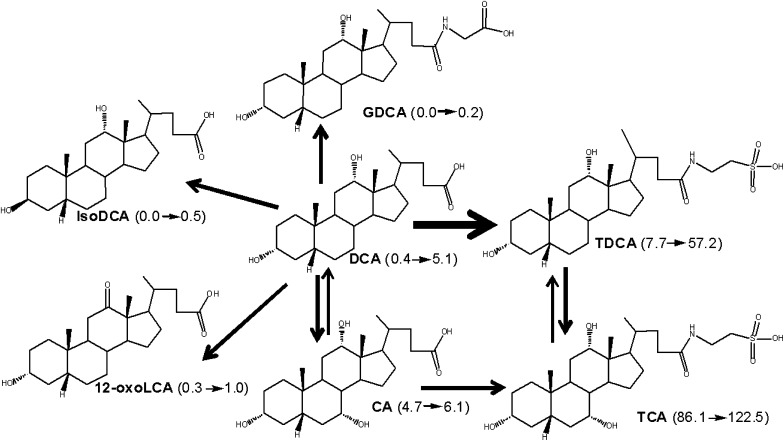
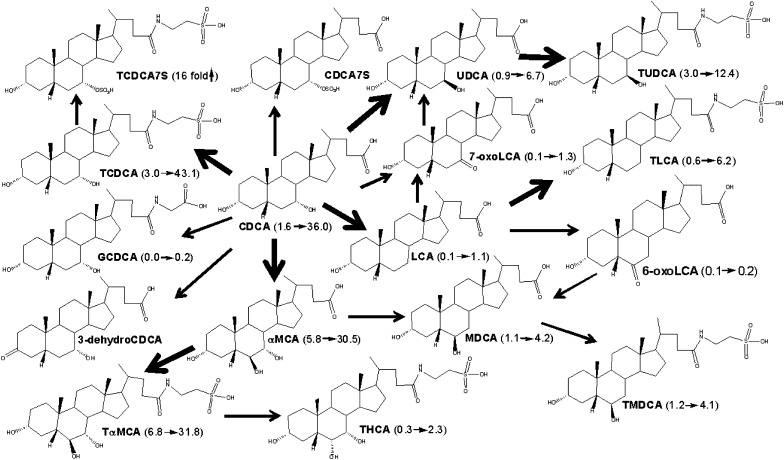
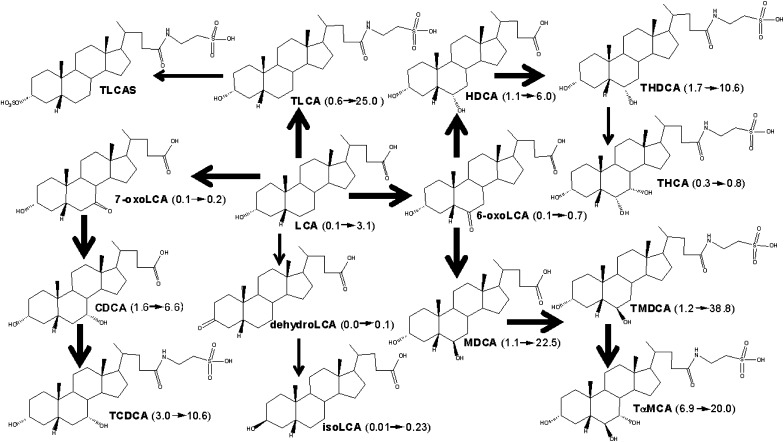
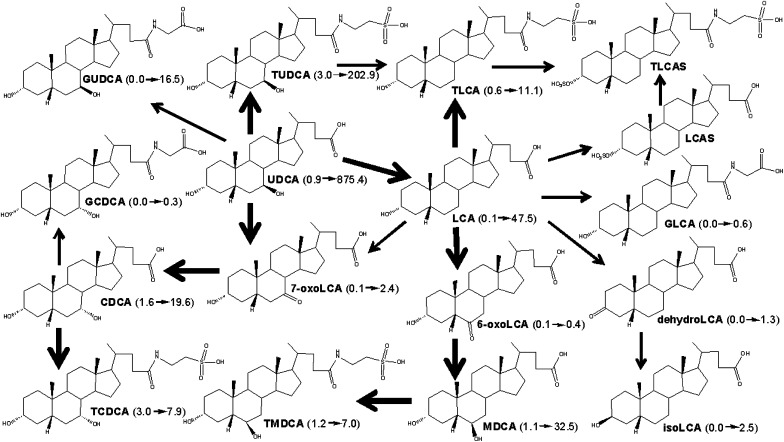
An improved ultra performance liquid chromatography-tandem mass spectrometry (UPLC/MS/MS) method was established for the simultaneous analysis of various bile acids (BA) and applied to investigate liver BA content in C57BL/6 mice fed 1% cholic acid (CA), 0.3% deoxycholic acid (DCA), 0.3% chenodeoxycholic acid (CDCA), 0.3% lithocholic acid (LCA), 3% ursodeoxycholic acid (UDCA), or 2% cholestyramine (resin). Results indicate that mice have a remarkable ability to maintain liver BA concentrations. The BA profiles in mouse livers were similar between CA and DCA feedings, as well as between CDCA and LCA feedings. The mRNA expression of Cytochrome P450 7a1 (Cyp7a1) was suppressed by all BA feedings, whereas Cyp7b1 was suppressed only by CA and UDCA feedings. Gender differences in liver BA composition were observed after feeding CA, DCA, CDCA, and LCA, but they were not prominent after feeding UDCA. Sulfation of CA and CDCA was found at the 7-OH position, and it was increased by feeding CA or CDCA more in male than female mice. In contrast, sulfation of LCA and taurolithocholic acid (TLCA) was female-predominant, and it was increased by feeding UDCA and LCA. In summary, the present systematic study on BA metabolism in mice will aid in interpreting BA-mediated gene regulation and hepatotoxicity.


Figures

Fig. 1.
Fig. 1.
Chemical structure of bile acids.
Fig. 2.
Fig. 2.
TCA7S (A), CA7S (B), and TCDCA7S (C) in livers of mice fed BAs and resin. The peak areas of TCA7S, TCDCA7S, and CA7S were normalized to that of G-CDCA-d4. The data are expressed as the mean ± SEM for five mice in each group. *Statistically significant difference between the same gender of control and BA-fed groups (P < 0.05). #Statistically significant difference between male and female mouse livers in the same group (P < 0.05). BA, bile acid; CA, cholic acid; CA7S, cholic acid 7-sulfate; Cont, control; CDCA, chenodeoxycholic acid; DCA, deoxycholic acid; LCA, lithocholic acid; TCA7S, taurocholic acid 7-sulfate; TCDCA, taurochenodeoxycholic acid; UDCA, ursodeoxycholic acid; WT, wild-type.
Fig. 3.
Fig. 3.
The mRNA levels of BA synthetic genes in livers of mice fed BAs and resin. Total RNA from livers of control and BA-fed mice (n = 5/gender/group) were analyzed by multiplex suspension array. The mRNA level of each gene was normalized to GAPDH. All data are expressed as mean ± SEM. for five mice in each group. *Statistically significant difference between the same gender of control and BA-fed groups (P < 0.05). #Statistically significant difference between male and female mouse livers in the same group (P < 0.05). BA, bile acid; CA, cholic acid; Cont, control; CDCA, chenodeoxycholic acid; Cyp, Cytochrome P450; DCA, deoxycholic acid; LCA, lithocholic acid; UDCA, ursodeoxycholic acid; WT, wild-type.
Fig. 4.
Fig. 4.
A scheme showing proposed metabolic pathways for CA in mice. The dark arrows indicate the major metabolic pathway. The number in the parenthesis indicates the average concentration of individual BAs in mouse livers. CA (4.7→18.8) means that CA was increased from 4.7 to 18.8 nmol/g in livers of male mice fed CA. TCA7S (92%↑) means that TCA7S was increased 92% in livers of male mice fed CA. BA, bile acid; CA, cholic acid; CA7S, cholic acid 7-sulfate; DCA, deoxycholic acid; GCA, glycocholic acid; GCDCA, glycochenodeoxycholic acid; LCA, lithocholic acid; TCA, taurocholic acid; TCA7S, taurocholic acid 7-sulfate; TDCA, taurodeoxycholic acid.
Fig. 5.
Fig. 5.
A scheme showing proposed metabolic pathways for DCA in mice. The dark arrows indicate the major metabolic pathway. The number in the parenthesis indicates the average concentration of individual BAs in mouse livers. DCA (0.4→5.1) means that DCA was increased from 0.4 to 5.1 nmol/g in livers of male mice fed DCA. BA, bile acid; CA, cholic acid; DCA, deoxycholic acid; GDCA, glycodeoxycholic acid; LCA, lithocholic acid; TCA, taurocholic acid; TDCA, taurodeoxycholic acid.
Fig. 6.
Fig. 6.
A scheme showing proposed metabolic pathways for CDCA in mice. The dark arrows indicate the major metabolic pathway. The number in the parenthesis indicates the average concentration of individual BAs in mouse livers. CDCA (1.6→36.0) means that CDCA was increased from 1.6 to 36.0 nmol/g in livers of male mice fed CDCA. BA, bile acid; CDCA, chenodeoxycholic acid; CDCA7S, chenodeoxycholic acid 7-sulfate; GCDCA, glycochenodeoxycholic acid; LCA, lithocholic acid; αMCA, α-muricholic acid; MDCA, murideoxycholic acid; TCDCA, taurochenodeoxycholic acid; TDCA, taurodeoxycholic acid; TDCA7S, taurodeoxycholic acid 7-sulfate; TαMCA, tauro-α-muricholic acid; THCA, taurohyocholic acid; TMDCA, tauromurideoxycholic acid; TUDCA, tauroursodeoxycholic acid; UDCA, ursodeoxycholic acid.
Fig. 7.
Fig. 7.
A scheme showing proposed metabolic pathways for LCA in mice. The dark arrows indicate the major metabolic pathway. The number in the parenthesis indicates the average concentration of individual BAs in mouse livers. LCA (0.1→3.1) means that LCA was increased from 0.1 to 3.1 nmol/g in livers of male mice fed LCA. BA, bile acid; CDCA, chenodeoxycholic acid; HDCA, hyodeoxycholic acid; LCA, lithocholic acid; MDCA, murideoxycholic acid; TCDCA, taurochenodeoxycholic acid; THCA, taurohyocholic acid; THDCA, taurohyodeoxycholic acid; TLCA, taurolithocholic acid; TLCAS, taurolithocholic acid sulfate; TαMCA, tauro-α-muricholic acid; TMDCA, tauromurideoxycholic acid.
Fig. 8.
Fig. 8.
A scheme showing proposed metabolic pathways for UDCA in mice. The dark arrows indicate the major metabolic pathway. The number in the parenthesis indicates the average concentration of individual BAs in mouse livers. UDCA (0.9→875.4) means that UDCA was increased from 0.9 to 875.4 nmol/g in livers of male mice fed UDCA. BA, bile acid; CA, cholic acid; CDCA, chenodeoxycholic acid; GLCA, glycolithocholic acid; GCDCA, glycochenodeoxycholic acid; GUDCA, glycoursodeoxycholic acid; LCA, lithocholic acid; MDCA, murideoxycholic acid; TCDCA, taurochenodeoxycholic acid; TLCA, taurolithocholic acid; TLCAS, taurolithocholic acid sulfate; TMDCA, tauromurideoxycholic acid; TUDCA, tauroursodeoxycholic acid; UDCA, ursodeoxycholic acid.

References

    1. Chiang J. Y. 2002. Bile acid regulation of gene expression: roles of nuclear hormone receptors. Endocr. Rev. 23: 443–463. - PubMed
    1. Botham K. M., Boyd G. S. 1983. The metabolism of chenodeoxycholic acid to beta-muricholic acid in rat liver. Eur. J. Biochem. 134: 191–196. - PubMed
    1. Hofmann A. F., Hagey L. R. 2008. Bile acids: chemistry, pathochemistry, biology, pathobiology, and therapeutics. Cell. Mol. Life Sci. 65: 2461–2483. - PMC - PubMed
    1. Hofmann A. F., Sjovall J., Kurz G., Radominska A., Schteingart C. D., Tint G. S., Vlahcevic Z. R., Setchell K. D. 1992. A proposed nomenclature for bile acids. J. Lipid Res. 33: 599–604. - PubMed
    1. Deo A. K., Bandiera S. M. 2008. Identification of human hepatic cytochrome p450 enzymes involved in the biotransformation of cholic and chenodeoxycholic acid. Drug Metab. Dispos. 36: 1983–1991. - PubMed

Publication types

MeSH terms