

Nucleotide supply, not local histone acetylation, sets replication origin usage in transcribed regions
- PMID: 20671737
- PMCID: PMC2933864
- DOI: 10.1038/embor.2010.112
Nucleotide supply, not local histone acetylation, sets replication origin usage in transcribed regions
Abstract
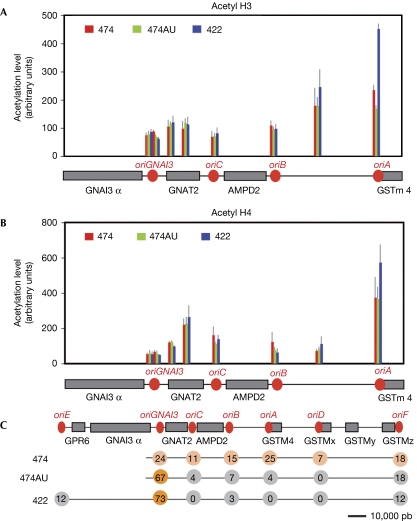
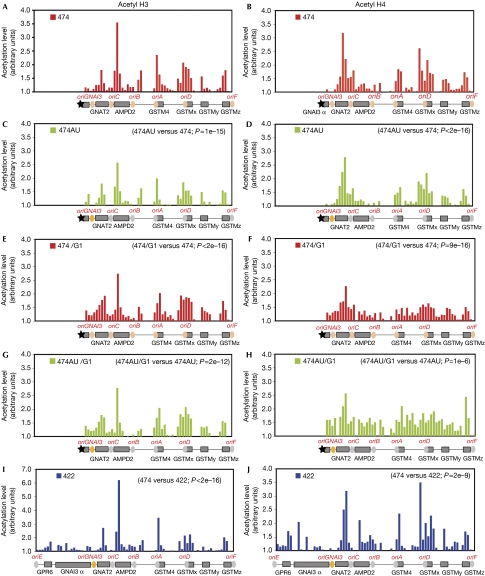
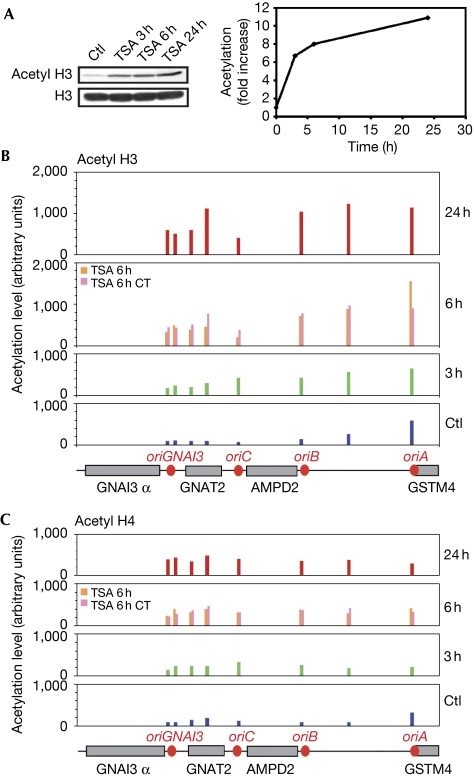
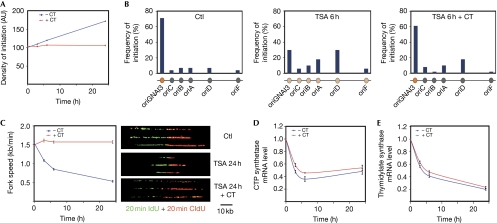
In eukaryotes, only a fraction of replication origins fire at each S phase. Local histone acetylation was proposed to control firing efficiency of origins, but conflicting results were obtained. We report that local histone acetylation does not reflect origin efficiencies along the adenosine monophosphate deaminase 2 locus in mammalian fibroblasts. Reciprocally, modulation of origin efficiency does not affect acetylation. However, treatment with a deacetylase inhibitor changes the initiation pattern. We demonstrate that this treatment alters pyrimidine biosynthesis and decreases fork speed, which recruits latent origins. Our findings reconcile results that seemed inconsistent and reveal an unsuspected effect of deacetylase inhibitors on replication dynamics.
Conflict of interest statement
The authors declare that they have no conflict of interest.
Figures
Similar articles
-
The histone deacetylase inhibitor trichostatin A alters the pattern of DNA replication origin activity in human cells.Nucleic Acids Res. 2005 Jan 13;33(1):325-36. doi: 10.1093/nar/gki177. Print 2005. Nucleic Acids Res. 2005. PMID: 15653633 Free PMC article.
-
Control of replication initiation by the Sum1/Rfm1/Hst1 histone deacetylase.BMC Mol Biol. 2008 Nov 6;9:100. doi: 10.1186/1471-2199-9-100. BMC Mol Biol. 2008. PMID: 18990212 Free PMC article.
-
Chromatin regulates origin activity in Drosophila follicle cells.Nature. 2004 Jul 15;430(6997):372-6. doi: 10.1038/nature02694. Nature. 2004. PMID: 15254542
-
Histone deacetylase inhibitors as new cancer drugs.Curr Opin Oncol. 2001 Nov;13(6):477-83. doi: 10.1097/00001622-200111000-00010. Curr Opin Oncol. 2001. PMID: 11673688 Review.
-
Nuclear matrix, dynamic histone acetylation and transcriptionally active chromatin.Mol Biol Rep. 1997 Aug;24(3):197-207. doi: 10.1023/a:1006811817247. Mol Biol Rep. 1997. PMID: 9291093 Review.
Cited by
-
[Regulation of DNA replication timing].Mol Biol (Mosk). 2013 Jan-Feb;47(1):12-37. doi: 10.1134/s0026893312060118. Mol Biol (Mosk). 2013. PMID: 23705493 Review. Russian.
-
USF binding sequences from the HS4 insulator element impose early replication timing on a vertebrate replicator.PLoS Biol. 2012;10(3):e1001277. doi: 10.1371/journal.pbio.1001277. Epub 2012 Mar 6. PLoS Biol. 2012. PMID: 22412349 Free PMC article.
-
Genomic approaches to the initiation of DNA replication and chromatin structure reveal a complex relationship.Brief Funct Genomics. 2011 Jan;10(1):30-6. doi: 10.1093/bfgp/elr001. Epub 2011 Jan 28. Brief Funct Genomics. 2011. PMID: 21278082 Free PMC article. Review.
-
Replication Stress and Consequential Instability of the Genome and Epigenome.Molecules. 2019 Oct 27;24(21):3870. doi: 10.3390/molecules24213870. Molecules. 2019. PMID: 31717862 Free PMC article. Review.
-
Histone deacetylases 1 and 2 maintain S-phase chromatin and DNA replication fork progression.Epigenetics Chromatin. 2013 Aug 15;6(1):27. doi: 10.1186/1756-8935-6-27. Epigenetics Chromatin. 2013. PMID: 23947532 Free PMC article.
References
-
- Aggarwal BD, Calvi BR (2004) Chromatin regulates origin activity in Drosophila follicle cells. Nature 430: 372–376 - PubMed
-
- Anglana M, Apiou F, Bensimon A, Debatisse M (2003) Dynamics of DNA replication in mammalian somatic cells: nucleotide pool modulates origin choice and interorigin spacing. Cell 114: 385–394 - PubMed
-
- Courbet S, Gay S, Arnoult N, Wronka G, Anglana M, Brison O, Debatisse M (2008) Replication fork movement sets chromatin loop size and origin choice in mammalian cells. Nature 455: 557–560 - PubMed
Publication types
MeSH terms
Substances
LinkOut - more resources
Full Text Sources
Molecular Biology Databases
