. 2010 Feb 10;5(4):753-60.
doi: 10.1007/s11671-010-9553-x.

CdTe Quantum Dot/Dye Hybrid System as Photosensitizer for Photodynamic Therapy

Affiliations

CdTe Quantum Dot/Dye Hybrid System as Photosensitizer for Photodynamic Therapy

Aliaksandra Rakovich et al. Nanoscale Res Lett. .

Abstract

We have studied the photodynamic properties of novel CdTe quantum dots-methylene blue hybrid photosensitizer. Absorption spectroscopy, photoluminescence spectroscopy, and fluorescence lifetime imaging of this system reveal efficient charge transfer between nanocrystals and the methylene blue dye. Near-infrared photoluminescence measurements provide evidence for an increased efficiency of singlet oxygen production by the methylene blue dye. In vitro studies on the growth of HepG2 and HeLa cancerous cells were also performed, they point toward an improvement in the cell kill efficiency for the methylene blue-semiconductor nanocrystals hybrid system.

Keywords: Electron transfer; Nanocrystals; Photosensitiser; Quantum dots; Singlet oxygen.


Figures
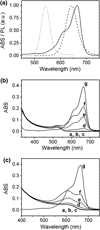
Figure 1
Figure 1
Spectroscopic measurements of methylene blue-CdTe nanocrystals solutions. Panel a normalized absorption spectrum of methylene blue dye (solid line) and photoluminescence spectra of 2.8-nm (dotted line) and 3.3-nm (dashed line) colloidal CdTe samples. The 2.8-nm NCs have much smaller spectral overlap with methylene blue. Panels b and c show the change in the absorption spectrum of b 2.8-nm and c 3.3-nm CdTe NCs with increasing dye concentration (curves “a”–”g”), respectively. There was no evidence of any major chemical changes upon the mixing of NCs and MB dye
Figure 2
Figure 2
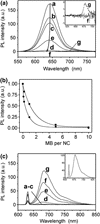
Changes in the photoluminescence of CdTe nanocrystals upon the addition of methylene blue. Panel a Quenching of PL of 3.3-nm CdTe NCs solution at increasing dye concentration (“a”–“g”). Inset: PL spectra for samples “3.3 f” and “3.3 g” reveal the complete quenching of dye molecules. Panel b Comparison of photoluminescence quenching curves for 2.8-nm and 3.3-nm NCs samples. Photoluminescence intensity against the number of MB molecules per NC for 2.8-nm (closed square) and 3.3-nm (closed circle) NCs shows that 3.3-nm NCs are quenched more by the same number of MB molecules. Difference could be attributed to the larger spectral overlap with dye’s absorption band for this NCs sample. Panel c Photoluminescence measurements of 2.8-nm CdTe NCs/MB mixtures at 633-nm excitation. At 633-nm excitation, the NCs are not excited and only emission from MB is observed, which decreases in accordance with the concentration of MB in samples “a”–“g”. The inset shows the emission spectra of the last two samples in the 2.8-nm NC series, normalized on absorption at excitation wavelength (633 nm). The two spectra overlap each other, so there is no quenching of MB emission when QDs are not excited
Figure 3
Figure 3
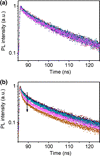
Time-resolved PL decay measurements on NC–MB mixtures. Panels a and b show PL decay data for 2.8-nm and 3.3-nm NC–MB mixtures at increasing NC–MB molar ratios, respectively. No change in the photoluminescence decay behavior was detected for 2.8-nm NCs, and only a small decrease in the shorter component of the decay was observed for 3.3-nm NCs (indicated by an arrow). This suggest that energy transfer only occurs for 3.3-nm NCs, for which spectral overlap was significant
Figure 4
Figure 4
Energy band off-sets for MB and the two NCs samples allow for charge transfer between the NCs and the dye
Figure 5
Figure 5
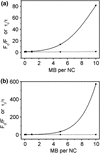
Stern–Volmer data for NC–MB mixtures. Panels a and b show intensity (closed square, solid line) and lifetime (closed circle, dashed line) Stern–Volmer plots for 2.8-nm and 3.3-nm NC series, respectively. The lifetime SV data is much smaller than the corresponding intensity SV data for both NCs samples, suggesting that static quenching dominates in this system
Figure 6
Figure 6
pH dependence of PL intensity for 3.3-nm NC set. The PL intensity of NCs increases at higher pHs due to better chemical stability. In the presence of MB, complete quenching is not observed for higher pHs even for 10 MB:QD molar ratio because the electrostatic interactions between NCs and MB are altered by high ionic strength
Figure 7
Figure 7
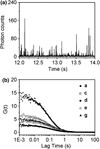
Fluorescence correlation spectroscopy measurements. Panel a. A representative TTTR trace for 3.3-nm NCs. The spikes correspond to NCs emitting photons while they are diffusing through the excitation volume. This data was used to calculate the cross-correlation curves. Panel b. Cross-correlation curves for 3.3-nm NC set show a decreasing trend in data. The diffusion constants given in Table 2 were calculated from fits to this data
Figure 8
Figure 8
Direct spectroscopic observation of single oxygen. Top panel. NIR photoluminescence spectra shows the evolution of the singlet oxygen peak (1,268 nm) upon the addition of a small amount of 3.3-nm NCs (formula image, sample “3.3 f”) to a dilute MB solution (formula image, sample “3.3 g”), as indicated by an arrow. Bottom panel: The differential PL signal of the spectra shown in panel a. The peak singlet oxygen peak is clearly distinguishable above the noise
Figure 9
Figure 9
Cell viability studies involving the incubation of cells in MB–NC-containing mixtures after excitation with UV light. Panels a and b show the effect of increasing MB:NC ratio (a) and the effect of the time of excitation with UV light (b) on the growth of HeLa cancerous cells (green bars). The MB only (black bars) and QD only (red bars) controls are also shown. All data was normalized to the no NC or MB control sample. The error bars are shown in blue and represent the standard deviation in cell viability within 8 repeat samples. Higher QD:MB molar ratios and longer UV excitations gave best results over the control experiments in terms of the efficiency of MB acting as a photosensitizer

References

    1. Pecci L, Montefoschi G, Antonucci A, Costa M, Cavallini D. Biochem. 2003. p. 411. COI number [1:CAS:528:DC%2BD3sXotlynsQ%3D%3D] - DOI - PubMed
    1. Tardivo JP, Giglio AD, de Oliveira CS, Gabrielli DS, Junqueira HC, Tada DB, Severino D, de Turchiello RF, Baptista MS. Photodiagnosis Photodyn. 2005. p. 175. COI number [1:CAS:528:DC%2BD28Xot1ehtw%3D%3D] - DOI - PubMed
    1. Severino D, Junqueira HC, Gugliotti M, Gabrielli DS, Baptista MS. Photochem. 2003. p. 459. COI number [1:CAS:528:DC%2BD3sXktlWjuro%3D] - DOI - PubMed
    1. Lee SK, Mills A. J. Fluorescence. 2003. p. 375. COI number [1:CAS:528:DC%2BD3sXotFCgs7g%3D]; Bibcode number [2003AIPC..676..375L] - DOI
    1. Eichkorn K, Ahlrichs R. Chem. 1998. p. 235. COI number [1:CAS:528:DyaK1cXjtVamtLg%3D]; Bibcode number [1998CPL...288..235E] - DOI

LinkOut - more resources