Review
. 2009:2:147-71.
doi: 10.1109/RBME.2009.2034865. Epub 2009 Oct 30.

Histopathological image analysis: a review

Affiliations
Review

Histopathological image analysis: a review

Metin N Gurcan et al. IEEE Rev Biomed Eng. 2009.

Abstract

Over the past decade, dramatic increases in computational power and improvement in image analysis algorithms have allowed the development of powerful computer-assisted analytical approaches to radiological data. With the recent advent of whole slide digital scanners, tissue histopathology slides can now be digitized and stored in digital image form. Consequently, digitized tissue histopathology has now become amenable to the application of computerized image analysis and machine learning techniques. Analogous to the role of computer-assisted diagnosis (CAD) algorithms in medical imaging to complement the opinion of a radiologist, CAD algorithms have begun to be developed for disease detection, diagnosis, and prognosis prediction to complement the opinion of the pathologist. In this paper, we review the recent state of the art CAD technology for digitized histopathology. This paper also briefly describes the development and application of novel image analysis technology for a few specific histopathology related problems being pursued in the United States and Europe.

Keywords: computer-assisted interpretation; histopathology; image analysis; microscopy analysis.


Figures

Figure 1.1
Figure 1.1
Schema showing different cancer grades prevalent in prostate cancer.
Figure 2.1
Figure 2.1
(a) H&E image of a breast tumor tissue. Fluorescently labeled markers superimposed as green color on the H&E image, (b) β-catenin, (c) pan-keratin, and (d) smooth muscle α-actin, markers.
Figure 3.1
Figure 3.1
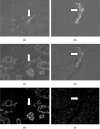
(a,b) Images from the first step acquisition. (c,d) Images from the second acquisition. (e,f) AF-free corrected images. Cy5 dye (a, c, e) is directly conjugated to Pan-Cadherin, a membrane protein. Cy3 dye (b,d,f) is directly conjugated to Estrogen Receptor. The arrows point to successfully removed the high-AF regions, such as blood cells and fat
Figure 4.1
Figure 4.1
(a) Original DCIS image with corresponding (b) likelihood scene obtained via a Bayesian classifier driven by color and texture, (c) Thresholded version of likelihood scene (95% confidence), (d) The final nuclear segmentation obtained by integrating the Bayesian classifier with the template matching scheme.
Figure 4.2
Figure 4.2
Results of the automatic segmentation algorithm (blue contours – lumen boundary, black contours -- inner boundary of the nuclei of the epithelial cells surrounding the gland). Shown from left to right are example images of benign epithelium, intermediate-, and high grade cancer.
Figure 5.1
Figure 5.1
Supervised extraction of histological features to describe tissue appearance of (a) benign epithelium, and (b) DCIS. Feature images for the 2 tissue classes (benign epithelium, DCIS) corresponding to Gabor wavelet features (b, e) and Haralick second order features (c, f) are shown.
Figure 5.2
Figure 5.2
Bone fracture and its corresponding ECM-aware cell-graph representation. Note the presence of a link between a pair of nodes in an ECM–aware cell-graph indicates not only topological closeness but also it implies the similarity in the surrounding ECM [91].
Figure 5.3
Figure 5.3
Illustrating the differences between cell-graphs for cancerous, healthy, and inflamed brain tissues. Panels (a)-(c) show brain tissue samples that are (a) cancerous (gliomas), (b) healthy, and (c) inflamed, but non-cancerous. Panels (d)-(f) show the cell-graphs corresponding to each tissue image. While the number of cancerous and inflamed tissue samples appear to have similar numbers and distributions of cells, the structure of their resulting cell-graphs shown in (d) and (f) are dramatically different. (Figure is taken from [92])
Figure 5.4
Figure 5.4
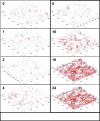
Cell graphs produced from human MSC embedded in 3D collagen matrices. Graphs show nuclei and development of edges (relationships) between them over time [91]. There is a phase transition sometime between hour 10 and hour 16 and the graph becomes connected.
Figure 5.5
Figure 5.5
(a) A digitized histopathology image of Grade 4 CaP and different graph based representations of tissue architecture via Delaunay Triangulation, Voronoi Diagram, and Minimum Spanning tree.
Figure 5.6
Figure 5.6
Digitized histological image at successively higher scales (magnifications) yields incrementally more discriminatory information in order to detect suspicious regions.
Figure 5.7
Figure 5.7
Results from the hierarchical machine learning classifier. (a) Original image with the tumor region (ground truth) in black contour, (b) results at scale 1, (c) results at scale 2, and (d) results at scale 3. Note that only areas determined as suspicious at lower scales are considered for further analysis at higher scales.
Figure 5.8
Figure 5.8
Low dimensional embedding reveals innate structure in textural features of invasive breast cancers, with clear separation of high grade tumors from low and intermediate grade tumors as assessed by Nottingham score. Combined Nottingham score 5 (yellow triangle), 6 (green squares), 7 (blue circles), and 8 (red triangles). The score of 8 corresponds to high grade tumors.
Figure 6.1
Figure 6.1
From left to right, (a) A digitized histopathology image, (b) cancer extent delineated in black by an expert pathologist, and cancer probability images generated by an Adaboost classifier at (c) low-, (d) intermediate, and (e) high image resolutions.
Figure 6.2
Figure 6.2
(a) (left panel) Low dimensional representation (via non-linear dimensionality reduction) of prostate cancer histopathology images (green circles are Grade 3 images and blue squares represent Grade 4 prostate cancer images). A non-linear SVM is used to classify objects in the reduced dimensional space. (b) Right panel shows a classification accuracy of over 90% in distinguishing between Grade 3, Grade 4 images and comparable accuracy in distinguishing between benign stromal, epithelial and prostate cancer tissue.
Figure 6.3
Figure 6.3
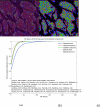
(a) A histological section stained with nuclear (DAPI-Blue), membrane (Pan-cadherin, red), and a target protein (Estrogen Receptor (ER), green). (b) Automatically segmented subcellular regions; membrane(red), nuclei(blue), cytoplasm(green). Dark colors show the non-epithelial regions. (c) CDF of the ER distributions (nuclei in blue, membrane in red and cytoplasm in green plots).
Figure 7.1
Figure 7.1
(a) Histology section of prostate gland with CaP extent stained in purple (upper right) and corresponding mapping of CaP extent via COFEMI onto (b) MRI (CaP extent shown in green). (c) Overlay of histological and MRI prostate sections following registration.

Similar articles

Cited by

References

    1. Mendez AJ, Tahoces PG, Lado MJ, Souto M, Vidal JJ. Computer-aided diagnosis: automatic detection of malignant masses in digitized mammograms. Med Phys. 1998 Jun;25:957–64. - PubMed
    1. Tang J, Rangayyan R, Xu J, El Naqa I, Yang Y. Computer-Aided Detection and Diagnosis of Breast Cancer with Mammography: Recent Advances. IEEE Trans Inf Technol Biomed. 2009 Jan 20; - PubMed
    1. Rubin R, Strayer D, Rubin E, McDonald J. Rubin's pathology: clinicopathologic foundations of medicine. Lippincott Williams & Wilkins; 2007.
    1. Weind KL, Maier CF, Rutt BK, Moussa M. Invasive carcinomas and fibroadenomas of the breast: comparison of microvessel distributions--implications for imaging modalities. Radiology. 1998 Aug;208:477–83. - PubMed
    1. Bartels PH, Thompson D, Bibbo M, Weber JE. Bayesian belief networks in quantitative histopathology. Anal Quant Cytol Histol. 1992 Dec;14:459–73. - PubMed

Publication types