. 2010:2010:428325.
doi: 10.1155/2010/428325. Epub 2010 Jul 5.

A Comprehensive Study of Progressive Cytogenetic Alterations in Clear Cell Renal Cell Carcinoma and a New Model for ccRCC Tumorigenesis and Progression

Affiliations

A Comprehensive Study of Progressive Cytogenetic Alterations in Clear Cell Renal Cell Carcinoma and a New Model for ccRCC Tumorigenesis and Progression

Zhongfa Zhang et al. Adv Bioinformatics. 2010.

Abstract

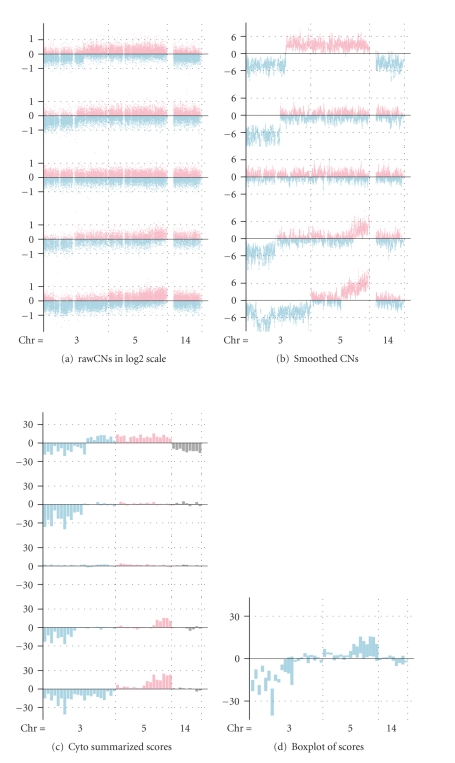
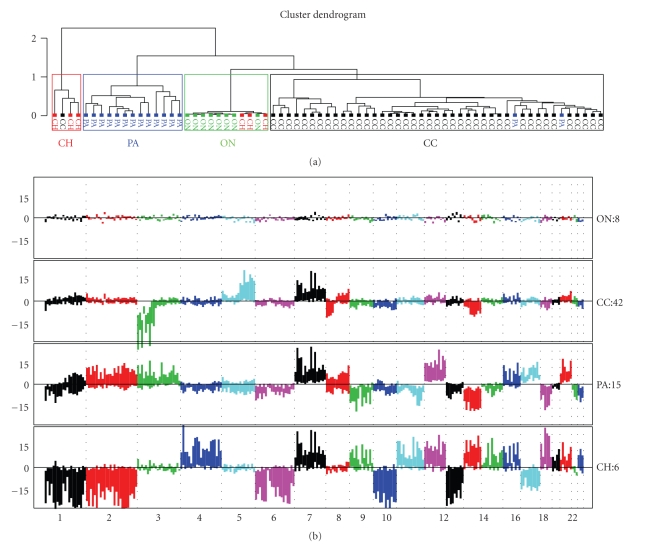
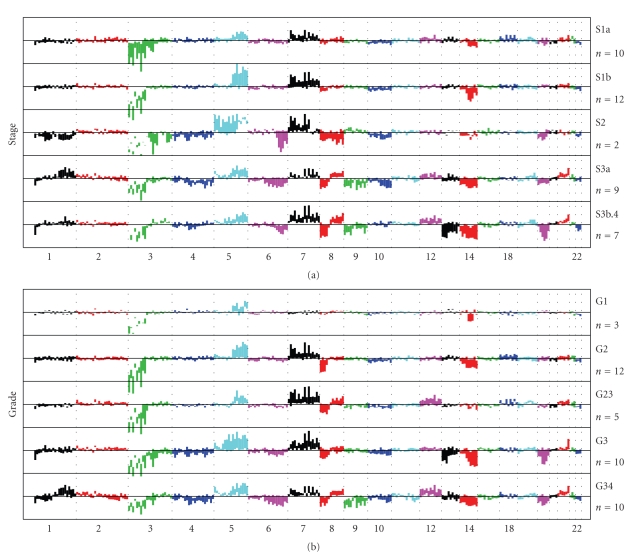
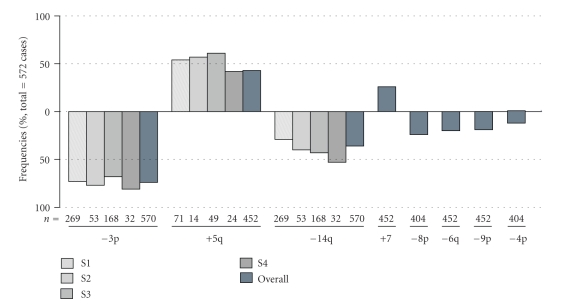
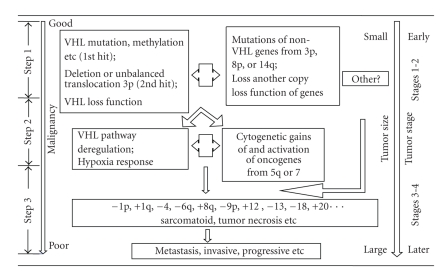
We present a comprehensive study of cytogenetic alterations that occur during the progression of clear cell renal cell carcinoma (ccRCC). We used high-density high-throughput Affymetrix 100 K SNP arrays to obtain the whole genome SNP copy number information from 71 pretreatment tissue samples with RCC tumors; of those, 42 samples were of human ccRCC subtype. We analyzed patterns of cytogenetic loss and gain from different RCC subtypes and in particular, different stages and grades of ccRCC tumors, using a novel algorithm that we have designed. Based on patterns of cytogenetic alterations in chromosomal regions with frequent losses and gains, we inferred the involvement of candidate genes from these regions in ccRCC tumorigenesis and development. We then proposed a new model of ccRCC tumorigenesis and progression. Our study serves as a comprehensive overview of cytogenetic alterations in a collection of 572 ccRCC tumors from diversified studies and should facilitate the search for specific genes associated with the disease.


Figures

Figure 1
Figure 1
Illustration of algorithm for obtaining and displaying the cytoband summarized SNP copy number scores for a group of samples. (a) Display of raw SNP copy number alterations for individual tumor samples. Each horizontal line in the figure represents data from one tumor sample (total of five tumor samples displayed). Raw SNP copy numbers are displayed in log 2 scale and plotted on the Y-axis. Negative copy numbers (indicating SNP losses) are depicted in blue and positive copy numbers (indicating SNP gain) are depicted in pink. The X-axis represents the physical ordering of individual SNPs along different chromosomes. (b) Display of smoothed SNP copy number alterations for individual tumor samples. Each horizontal line represents data from one tumor sample (total of five tumor samples displayed). (b) the smoothed copy number by moving t-test with window size 31, (c) the cytoband summarized SNP copy number scores using the adapted regional expression bias algorithm, and (d) boxplot of the summarized SNP copy number scores.
Figure 2
Figure 2
(a) Unsupervised clustering of RCC samples based on cytoband summarized SNP data. CH: chromophobe RCC, PA: papillary RCC; ON: oncocytoma, CC: clear cell. With few exceptions, tumors of a given subclass clustered together. Thus, each of the four RCC subtypes has a distinct pattern of cytogenetic alterations. (b) Somatic cytogenetic alteration profiles of RCC subtypes. RCC subtypes are ordered by complexity of molecular cytogenetic alterations. Each bar in the plot is a box with upper and lower bound of the box representing the third (75%, upper bound) and first quantiles (25%, lower bound) over the summarized SNP copy numbers by cgma method. The boxes are ordered from p-arm to q-arm followed by another chromosome. Only the somatic chromosomes are shown here. A positive value stands for gain, while a negative value stands for loss. Each chromosome is assigned a single color different from its neighbor chromosomes.
Figure 3
Figure 3
(a) Somatic cytogenetic alteration summarization based on SNP data, grouped by patient tumor stages in increasing order. Box plots were arranged as in Figure 2. The earliest stage S1a shows the fewest cytogenetic alterations, while the highest stage S3b4 shows the largest number of cytogenetic changes, indicating the cytogenetic progression of ccRCC tumors. −3p, +5q, +7, −8p, and −14 are among the earliest events during ccRCC tumorigenesis, while −1p, +1q, −4p, −6q, −9p, +12, −13, −18, and +20q are events occurring at later stages only. (b) Somatic cytogenetic alterations associated with tumor grade. Box plots are arranged as in Figure 2.
Figure 4
Figure 4
Relative frequencies of cytogenetic alterations in 572 ccRCC tumors from multiple sources.
Figure 5
Figure 5
Illustration of a proposed model of ccRCC tumor formation and progression.

Similar articles

Cited by

References

    1. Knudson AG., Jr. Mutation and cancer: statistical study of retinoblastoma. Proceedings of the National Academy of Sciences of the United States of America. 1971;68(4):820–823. - PMC - PubMed
    1. Tan M-H, Rogers CG, Cooper JT, et al. Gene expression profiling of renal cell carcinoma. Clinical Cancer Research. 2004;10(18, part 2):6315S–6321S. - PubMed
    1. Cohen HT, McGovern FJ. Renal-cell carcinoma. The New England Journal of Medicine. 2005;353(23):2477–2490. - PubMed
    1. Latif F, Tory K, Gnarra J, et al. Identification of the von Hippel-Lindau disease tumor suppressor gene. The Science. 1993;260(5112):1317–1320. - PubMed
    1. Skinnider BF, Folpe AL, Hennigar RA, et al. Distribution of cytokeratins and vimentin in adult renal neoplasms and normal renal tissue: potential utility of a cytokeratin antibody panel in the differential diagnosis of renal tumors. American Journal of Surgical Pathology. 2005;29(6):747–754. - PubMed

LinkOut - more resources