. 2010 Jul 30:5:47.
doi: 10.1186/1745-6150-5-47.

Some considerations for analyzing biodiversity using integrative metagenomics and gene networks

Affiliations

Some considerations for analyzing biodiversity using integrative metagenomics and gene networks

Lucie Bittner et al. Biol Direct. .

Abstract

Background: Improving knowledge of biodiversity will benefit conservation biology, enhance bioremediation studies, and could lead to new medical treatments. However there is no standard approach to estimate and to compare the diversity of different environments, or to study its past, and possibly, future evolution.

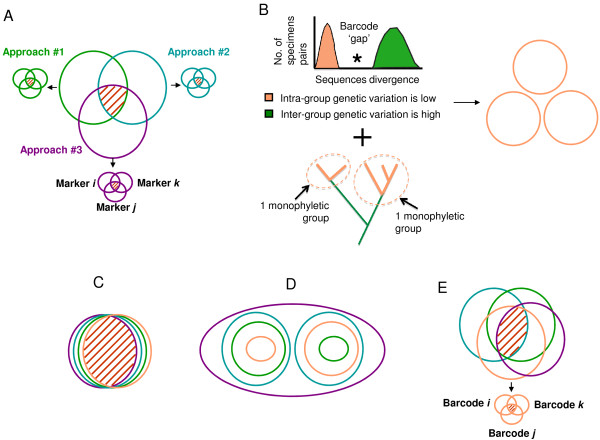
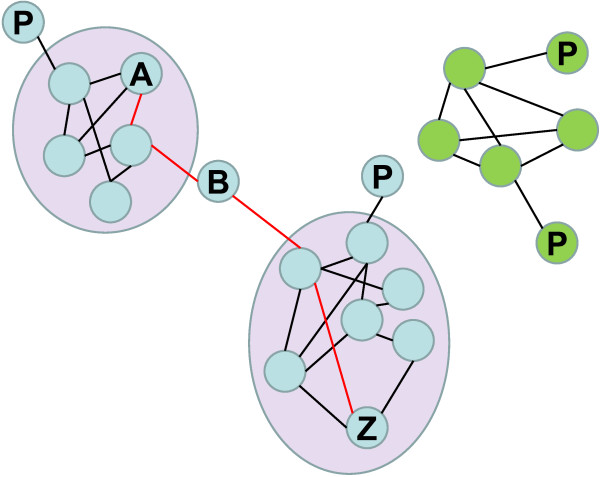
Presentation of the hypothesis: We argue that there are two conditions for significant progress in the identification and quantification of biodiversity. First, integrative metagenomic studies - aiming at the simultaneous examination (or even better at the integration) of observations about the elements, functions and evolutionary processes captured by the massive sequencing of multiple markers - should be preferred over DNA barcoding projects and over metagenomic projects based on a single marker. Second, such metagenomic data should be studied with novel inclusive network-based approaches, designed to draw inferences both on the many units and on the many processes present in the environments.

Testing the hypothesis: We reached these conclusions through a comparison of the theoretical foundations of two molecular approaches seeking to assess biodiversity: metagenomics (mostly used on prokaryotes and protists) and DNA barcoding (mostly used on multicellular eukaryotes), and by pragmatic considerations of the issues caused by the 'species problem' in biodiversity studies.

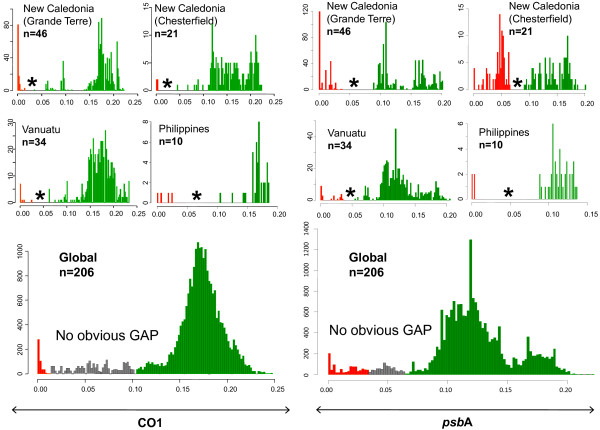
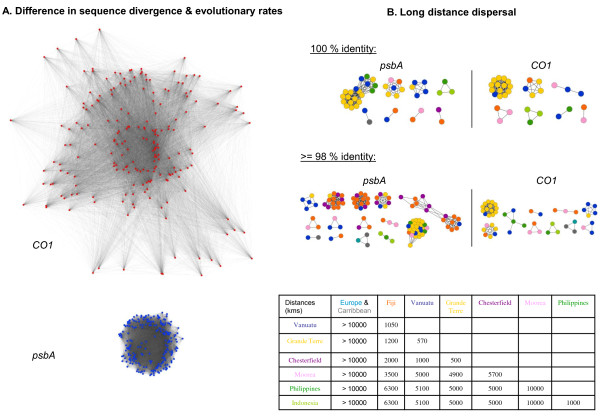
Implications of the hypothesis: Evolutionary gene networks reduce the risk of producing biodiversity estimates with limited explanatory power, biased either by unequal rates of LGT, or difficult to interpret due to (practical) problems caused by type I and type II grey zones. Moreover, these networks would easily accommodate additional (meta)transcriptomic and (meta)proteomic data.


Figures

Figure 1
Figure 1
Four remarkable situations when distinct species concepts are applied. Each species concept groups a set of organisms, as members of a species taxon, as illustrated by a colored circle (purple for the phylogenetic species, green for the recombining or biological species, blue for the morphological species, pink for the barcode-based species). The overlap between groups is indicated by red dashes. A. In prokaryotes, the groups defined by the various species concepts are largely not nested. A unified species concept would be a poor descriptor of biodiversity: inter-approach pluralism is an issue for species definition. So is intra-approach pluralism, as indicated by smaller circles corresponding to the incongruent groups proposed by different markers, for a given species concept. B. Exploratory use of DNA barcoding to define groups of specimens belonging to a same species. On a histogram of p-distances frequencies, the identification of a barcode gap provides a threshold over which two specimens cannot belong to the same species. The monophyly of specimens falling in a same group can also be assessed. C. The ideal case: all the species concepts identify the same sets of organisms. Intra- and inter-approach pluralisms are not a problem. A unified species concept is a good descriptor of biodiversity D. Type I grey zone: the species concepts produce a series of nested groups. Ranking these groups is an issue. E. Type II grey zone: the species concepts produce partially non-nested groups. Inter- and intra-approach pluralism can be problematic. For cases D & E, pragmatic descriptors would be more accurate and informative about biodiversity than a unified species concept.
Figure 2
Figure 2
Histograms of the frequency of p-distances for CO1 and psbA in a Corallinales Dataset. A. Results for the CO1 dataset: the horizontal axis represents the pairwise sequence divergence (p-distances) for the specimens of a given class of frequency; the vertical axis corresponds to the number of pairs of specimens of each class. 'n' indicates the number of specimens sampled for a given locality. Barcode gaps are indicated by a star. Inferred interspecific distances are reported in green, inferred intraspecific distances are reported in red. B. Results for the psbA dataset. Same legend. On the global sampling, no barcode gap can be defined. Several discontinuities exist in the distribution, as represented by the grey area. When more data are included (data not shown), the barcode gap disappears.
Figure 3
Figure 3
Gene networks of CO1 and psbA datasets. A. Sequence diversity of CO1 (in red) and psbA (in blue) datasets for the same 206 specimens represented by gene homology networks, using the same scale and the same parameters for display. Nodes are sequences, and edges lengths are roughly proportional to the percentage of sequence identity between sequences. Closer sequences are more identical. CO1 displays more genetic diversity than psbA, thus has evolved faster in these specimens. B. Network- based phylogeographic analysis of CO1 and psbA sequences only showing sequences sharing 100% identical sequences but found in distinct geographical sites. Same networks for sequences presenting over 98% of identity. Nodes are sequences, colored according to their geographical origin: orange for Fiji; yellow for New Caledonia - 'Grande Terre'; dark blue for Vanuatu; purple for New Caledonia - Chesterfield; sky-blue for Europe; pink for French Polynesia; dark green for Philippines; grey for the Caribbean; light green for Indonesia. The colour coded table indicates the corresponding distances between each pair of sites. The sequences with the highest proportion of identical matches are displayed closer in the graph.
Figure 4
Figure 4
An example network. Nodes (circles) are connected by edges (black lines), which may be assigned values or lengths. Blue and green nodes do not share any connections, so they fall into two separate subnetworks (called connected components). Likewise, any two blue nodes are connected by one or more paths. The shortest path between nodes A and Z is displayed in red. Densely connected parts of the network are called modules and are represented in purple here. Some nodes have remarkable topological properties. For example, node B has a high betweenness since it has a high probability of lying in the shortest path between two random nodes. Nodes P, on the opposite, are called peripheral, since they are highly eccentric.
Figure 5
Figure 5
An inclusive evolutionary gene network . This graph is a section of an EGN reconstructed using 454 reads from 4 marine environments. Each node represents a genetic sequence. Two nodes are connected by an edge when their corresponding sequences present a significant similarity. All nodes from a given connected component fall into an Operational Gene Family (OGF). Colors correspond to the environment of origin of the sequences, so single coloured OGFs are environment specific. Some OGFs show more genetic variability (indicated by a D), others are highly conserved. T marks OGFs with homologous copies carried on mobile elements. A/R indicates abundant/rare sequences. Circles identify modules, pg indicates when these modules are amenable to studies of population genetics. Topological properties of the connected components, along with the distribution of various colors, are not random. Genetic diversity in the red and blue environments seems complementary, as 77% the connected components separate sequences from these two environments.

References

    1. Morgan GJ. Evaluating Maclaurin and Sterelny's Conception of Biodiversity in Cases of Frequent, Promiscuous Lateral Gene Transfer. Biology and Philosophy. 2010. in press .
    1. Brennerova MV, Josefiova J, Brenner V, Pieper DH, Junca H. Metagenomics reveals diversity and abundance of meta-cleavage pathways in microbial communities from soil highly contaminated with jet fuel under air-sparging bioremediation. Environ Microbiol. 2009;11:2216–2227. doi: 10.1111/j.1462-2920.2009.01943.x. - DOI - PMC - PubMed
    1. Wolcott RD, Gontcharova V, Sun Y, Dowd SE. Evaluation of the bacterial diversity among and within individual venous leg ulcers using bacterial tag-encoded FLX and titanium amplicon pyrosequencing and metagenomic approaches. BMC Microbiol. 2009;9:226. doi: 10.1186/1471-2180-9-226. - DOI - PMC - PubMed
    1. Doolittle WF, Zhaxybayeva O. Metagenomics and the Units of Biological Organization. Bioscience. 2010;60:102–112. doi: 10.1525/bio.2010.60.2.5. - DOI
    1. Callicott JB, Crowder LB, Mumford K. Current normative concepts in conservation. Conservation Biology. 1999;13:22–35. doi: 10.1046/j.1523-1739.1999.97333.x. - DOI

Publication types