. 2010 Jul 30:10:206.
doi: 10.1186/1471-2180-10-206.

Sampling and pyrosequencing methods for characterizing bacterial communities in the human gut using 16S sequence tags

Affiliations

Sampling and pyrosequencing methods for characterizing bacterial communities in the human gut using 16S sequence tags

Gary D Wu et al. BMC Microbiol. .

Abstract

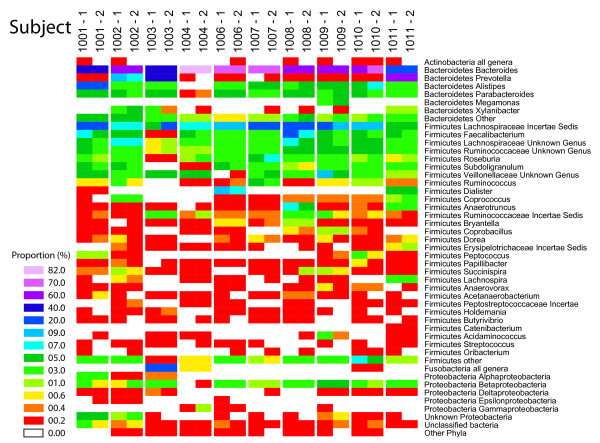
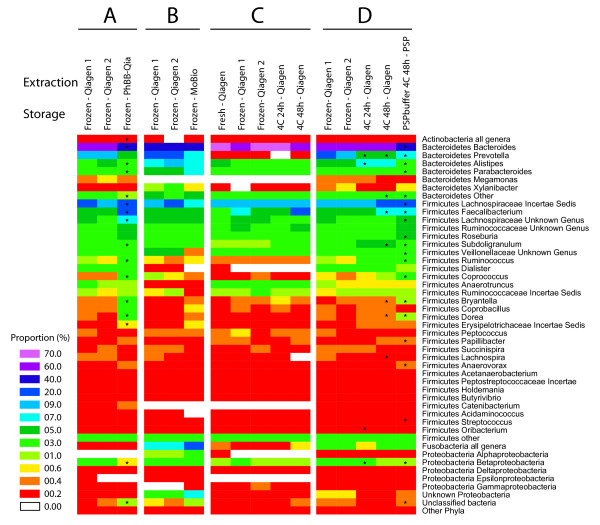
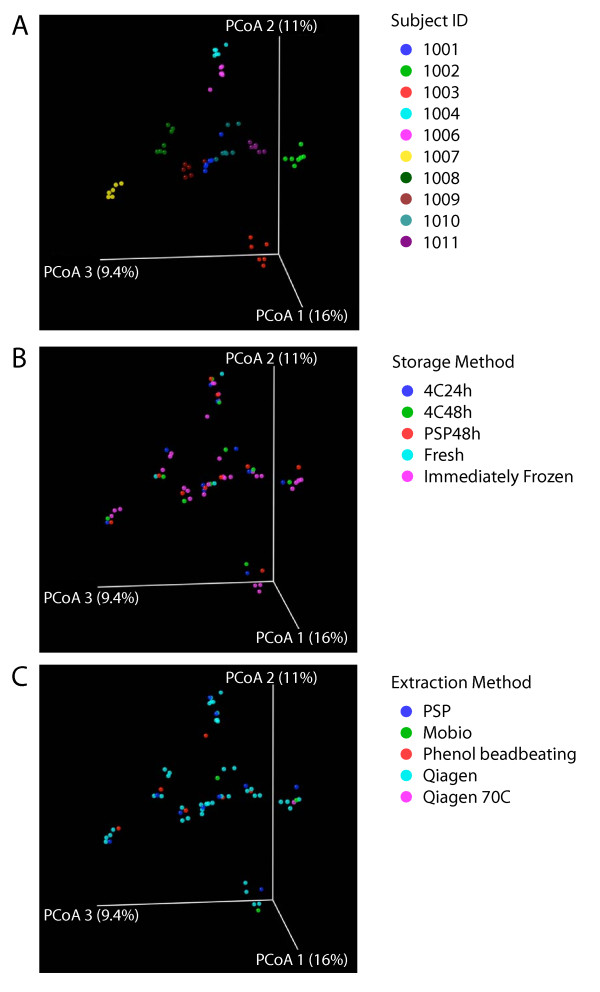
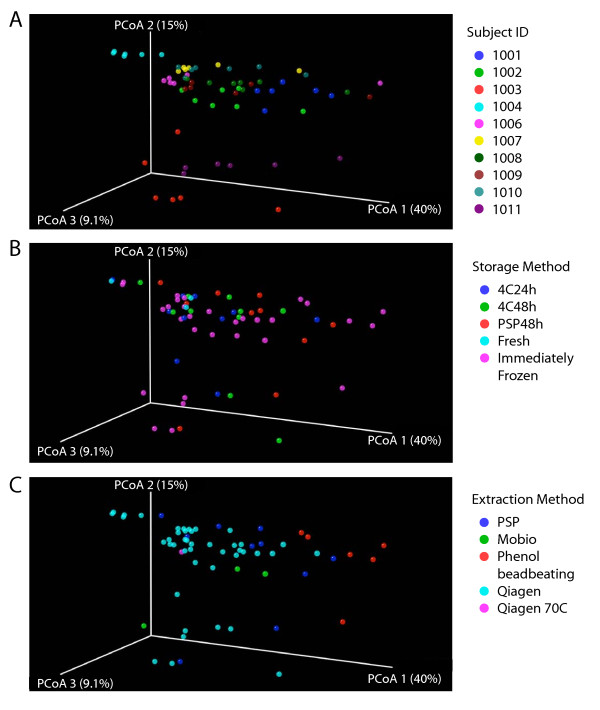
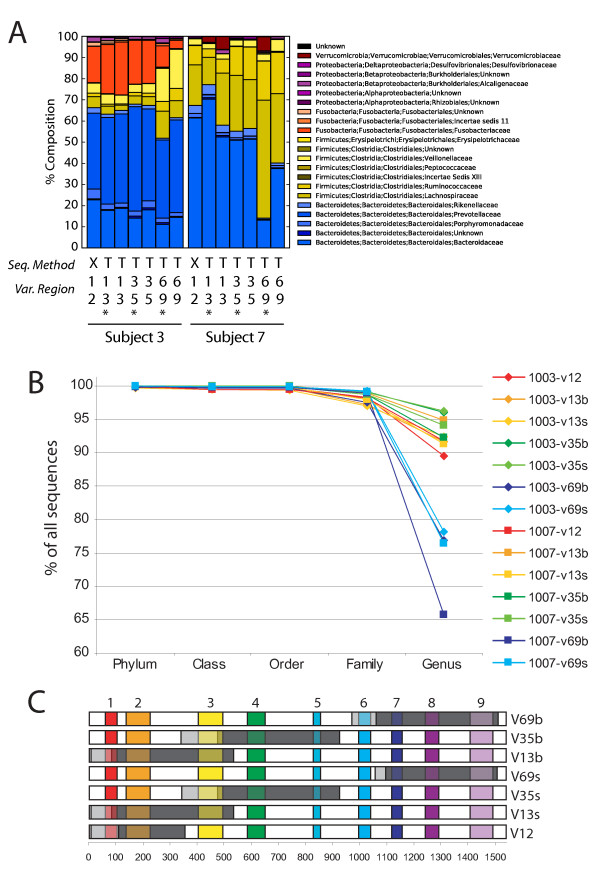
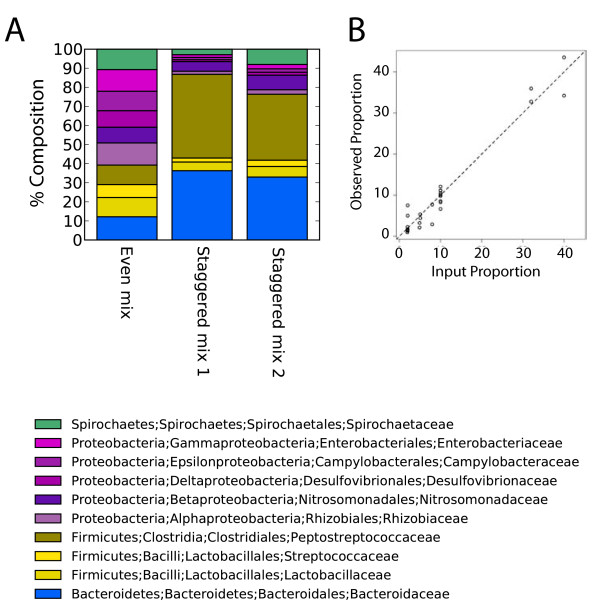
Intense interest centers on the role of the human gut microbiome in health and disease, but optimal methods for analysis are still under development. Here we present a study of methods for surveying bacterial communities in human feces using 454/Roche pyrosequencing of 16S rRNA gene tags. We analyzed fecal samples from 10 individuals and compared methods for storage, DNA purification and sequence acquisition. To assess reproducibility, we compared samples one cm apart on a single stool specimen for each individual. To analyze storage methods, we compared 1) immediate freezing at -80 degrees C, 2) storage on ice for 24 or 3) 48 hours. For DNA purification methods, we tested three commercial kits and bead beating in hot phenol. Variations due to the different methodologies were compared to variation among individuals using two approaches--one based on presence-absence information for bacterial taxa (unweighted UniFrac) and the other taking into account their relative abundance (weighted UniFrac). In the unweighted analysis relatively little variation was associated with the different analytical procedures, and variation between individuals predominated. In the weighted analysis considerable variation was associated with the purification methods. Particularly notable was improved recovery of Firmicutes sequences using the hot phenol method. We also carried out surveys of the effects of different 454 sequencing methods (FLX versus Titanium) and amplification of different 16S rRNA variable gene segments. Based on our findings we present recommendations for protocols to collect, process and sequence bacterial 16S rDNA from fecal samples--some major points are 1) if feasible, bead-beating in hot phenol or use of the PSP kit improves recovery; 2) storage methods can be adjusted based on experimental convenience; 3) unweighted (presence-absence) comparisons are less affected by lysis method.


Figures

Figure 1
Figure 1
Composition of the gut microbiome in the ten subjects studied. Bacterial taxonomic assignments are indicated to the right of the heat map at the Phylum and Genus level except in cases where small numbers were detected (e. g. Proteobacteria), in which case taxa are summarized at higher levels. The relative abundance of each bacterial group is color coded as indicated by the key on the left (the number beside each colored tile indicates the lower bound for the indicated interval). Two samples were compared for each stool specimen, sampled on cm a part but otherwise worked up identically (conditions 1 and 2 in Table 2). The numbers of reads for the two samples from each subject were compared for significant differences using Fisher's exact test. The * indicates P < 0.05. Note that because each sequence read is treated as an individual measurement, the sample size is very large, with the result that many taxa with only modest differences nevertheless achieve significance.
Figure 2
Figure 2
Comparison of the recovery of different bacterial taxa with use of different stool storage and DNA isolation methods. 473,169 sequence reads were used to characterize the 57 communities analyzed. All subjects tested for each method were pooled for comparison (summarized in Additional File 1). Methods are numbered at the top of the heat map. For the heat map scale, the number beside each colored tile indicates the lower bound for the indicated interval. Taxa are mostly indicated at the genus level; raee taxa are pooled. A) Comparison of DNA isolation using the Qiagen stool kit (methods 1 and 2) to lysis by bead-beating in hot phenol (method 9). Six subjects were compared. B) Comparison of the Qiagen stool kit samples (methods 1 and 2) to the MoBio Powersoil kit (method 3). Three subjects were compared. C) Comparison of methods for storage of stool specimens. DNA was prepared from fresh samples (method 8), samples stored frozen at -80 for several days (methods 1 and 2), or samples stored at 4°C for 24 hr (method 4) or 48 hr (method 5). Three subjects were compared. D) Comparison of stool storage in PSP (method 6) to storage methods 1, 2, 4 and 5. All 10 subjects were compared. For A) and D), the methods were compared using the Wilcoxon signed rank test to identify bacterial groups that significantly changed in proportion. (* indicates P < 0.05). Numbers of samples were too low in B) and C) for statistical testing.
Figure 3
Figure 3
Comparison of the presence or absence of different bacterial taxa under the different storage conditions or DNA isolation methods tested using unweighted UniFrac. Unweighted UniFrac was used to generate a matrix of pairwise distances between communities, then a scatterplot was generated from the matrix of distances using Principal Coordinate Analysis. The same scatterplot is shown in A)-C), but colored by subject A), storage method B), or extraction method C). The P-values cited in the text were generated using distances from the original UniFrac matrix.
Figure 4
Figure 4
Comparison of the relative abundance of different bacterial taxa under the conditions tested using weighted UniFrac. Weighted UniFrac was used to generate a matrix of pairwise distances between communities, then a scatterplot was generated from the matrix of distances using Principal Coordinate Analysis. The same scatterplot is shown in A)-C), but colored by subject A), storage method B), or extraction method C). The P-values cited in the text were generated using distances from the original UniFrac matrix.
Figure 5
Figure 5
Analysis of community composition determined using different recovery and sequencing strategies. A) Results of analysis of Subjects 3 and 7 are shown comparing sequencing using 454/Roche GS FLX versus Titanium, and use of different variable region primers. To characterize the Titanium sequencing method, 295,946 454 Titanium sequence reads were used (Additional File 2). The 454 GS FXL reads are from the samples in Additional File 1. The percentages of different bacterial families are compared in bar graphs. "Seq. Method" indicates GS FLX ("X") or Titanium ("T"). The families present are indicated in the key beside the graphs. "Var. Region" indicates the 16S rRNA gene region amplified by each primer set (sequences used are in Additional File 4). The * indicates slightly different versions of the primers used as specified in Additional File 4. B) Percentages of sequences assigned for each primer set as a function of taxonomic level. C) Summary of regions amplified and regions sequenced for each primer set. Gray indicates the regions amplified, dark gray indicates the regions sequenced, light gray indicates regions amplified but not sequenced.
Figure 6
Figure 6
Analysis of recovery efficiency after 454/Roche GS FLX sequencing of a cloned DNA mock community. A) Bar graph illustrating proportional recovery of 16S rRNA gene pyrosequence reads from a plasmid DNA mock community. A total of 28,161 sequence reads were used for this analysis (Additional File 4). Each of the 10 templates consisted of a bacterial 16S rRNA gene sequence cloned in a bacterial plasmid. "Even mix" indicates that the same copy number for each of the 10 templates was used in the amplification reaction. "Staggered mix" indicates different amounts. The "Staggered mix 2" sample was amplified with a different polymerase mixture (Promega's GreenTaq Master Mix, Madison, WI) instead of AmpliTaq which was used in all other experiments, revealing that the two mixtures yielded similar results. The taxonomic assignments in this and subsequent figures are color coded as indicated. B) Scatter plot comparing the theoretical proportion of each input sequences (x-axis) to the proportions inferred from 454 GS FLX sequence data (y-axis).

References

    1. Savage DC. Microbial ecology of the gastrointestinal tract. Annu Rev Microbiol. 1977;31:107–133. doi: 10.1146/annurev.mi.31.100177.000543. - DOI - PubMed
    1. Zaneveld J, Turnbaugh PJ, Lozupone C, Ley RE, Hamady M, Gordon JI, Knight R. Host-bacterial coevolution and the search for new drug targets. Current opinion in chemical biology. 2008;12(1):109–114. doi: 10.1016/j.cbpa.2008.01.015. - DOI - PMC - PubMed
    1. Ley RE, Hamady M, Lozupone C, Turnbaugh PJ, Ramey RR, Bircher JS, Schlegel ML, Tucker TA, Schrenzel MD, Knight R. Evolution of mammals and their gut microbes. Science (New York, NY) 2008;320(5883):1647–1651. - PMC - PubMed
    1. Costello EK, Lauber CL, Hamady M, Fierer N, Gordon JI, Knight R. Bacterial Community Variation in Human Body Habitats Across Space and Time. Science (New York, NY) 2009;326(5960):1694–7. - PMC - PubMed
    1. Eckburg PB, Bik EM, Bernstein CN, Purdom E, Dethlefsen L, Sargent M, Gill SR, Nelson KE, Relman DA. Diversity of the human intestinal microbial flora. Science. 2005;308(5728):1635–1638. doi: 10.1126/science.1110591. - DOI - PMC - PubMed

Publication types